Each photograph records a particular place and date. Follow its regional entry to explore the environmental evidence, reporting periods and questions still open.
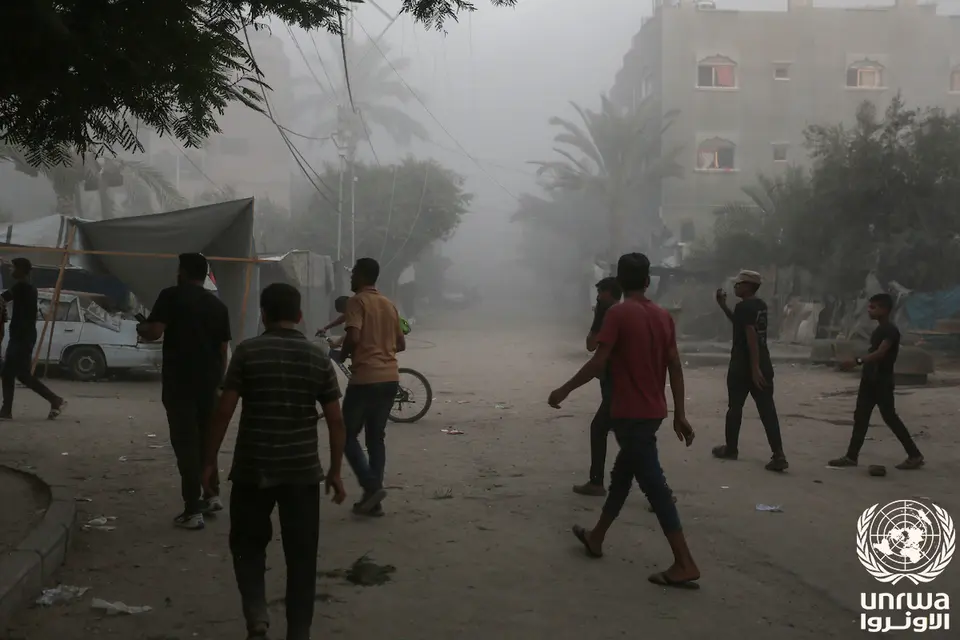
Documentary photograph · 7 August 2024
Deir al-Balah, Gaza Strip
People in a damaged street after bombing in Deir al-Balah, as identified in the original UNRWA caption.
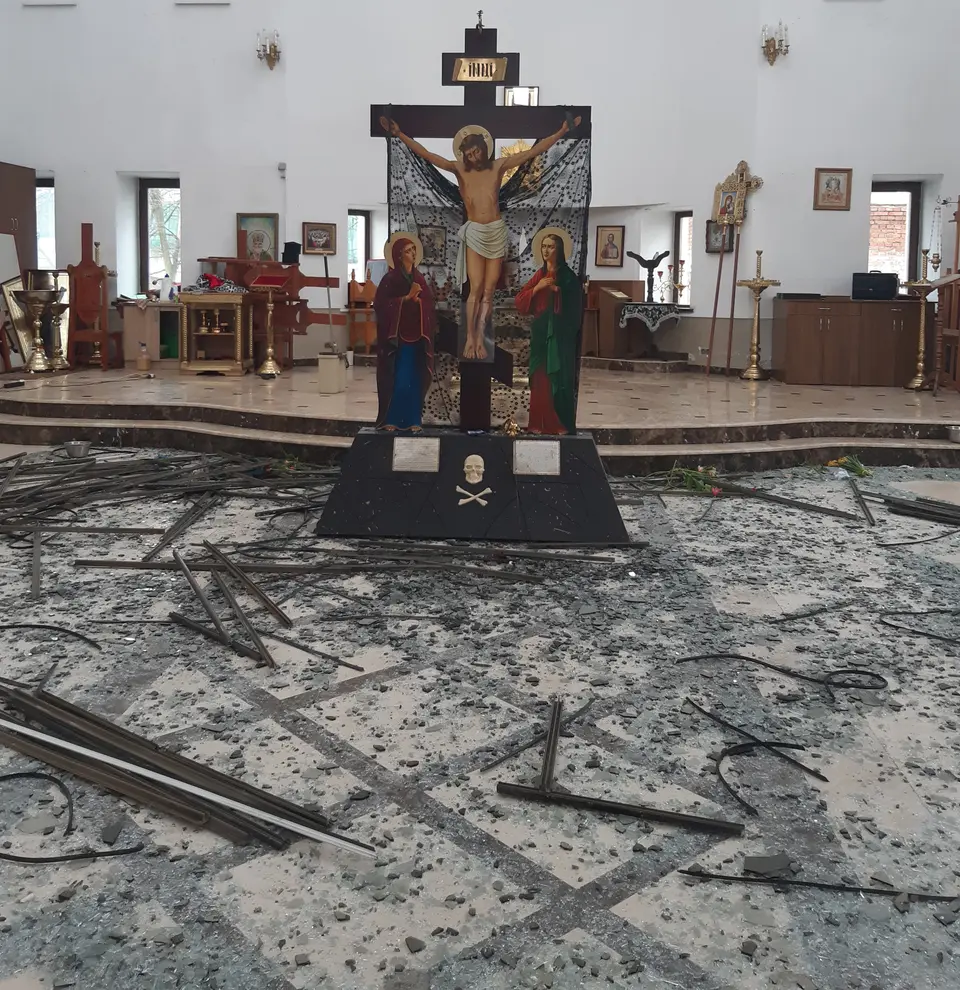
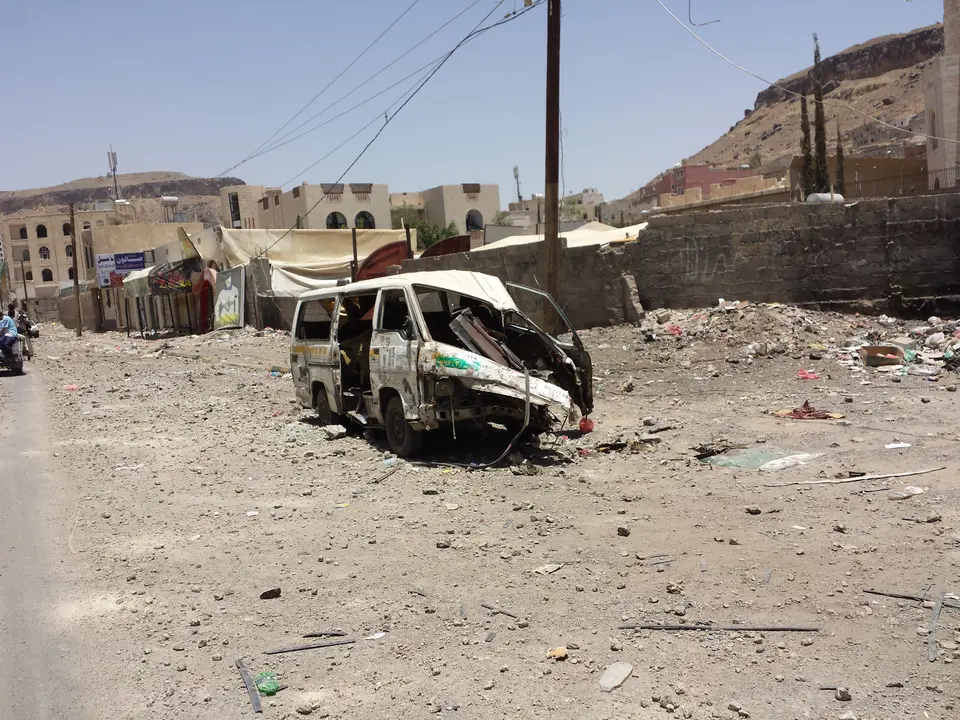
Photographs show dated scenes, not present-day conditions or measured chemical contamination. The Kyiv photograph is separate from the Kakhovka case in Ukraine’s brief; the Sana’a image predates the Yemen waste-sector report. Web display copies are resized and compressed with the complete frame retained. Original images and reuse terms are linked in each credit.
Maps help frame environmental questions. Each map below represents a different kind of information, with its own limits.
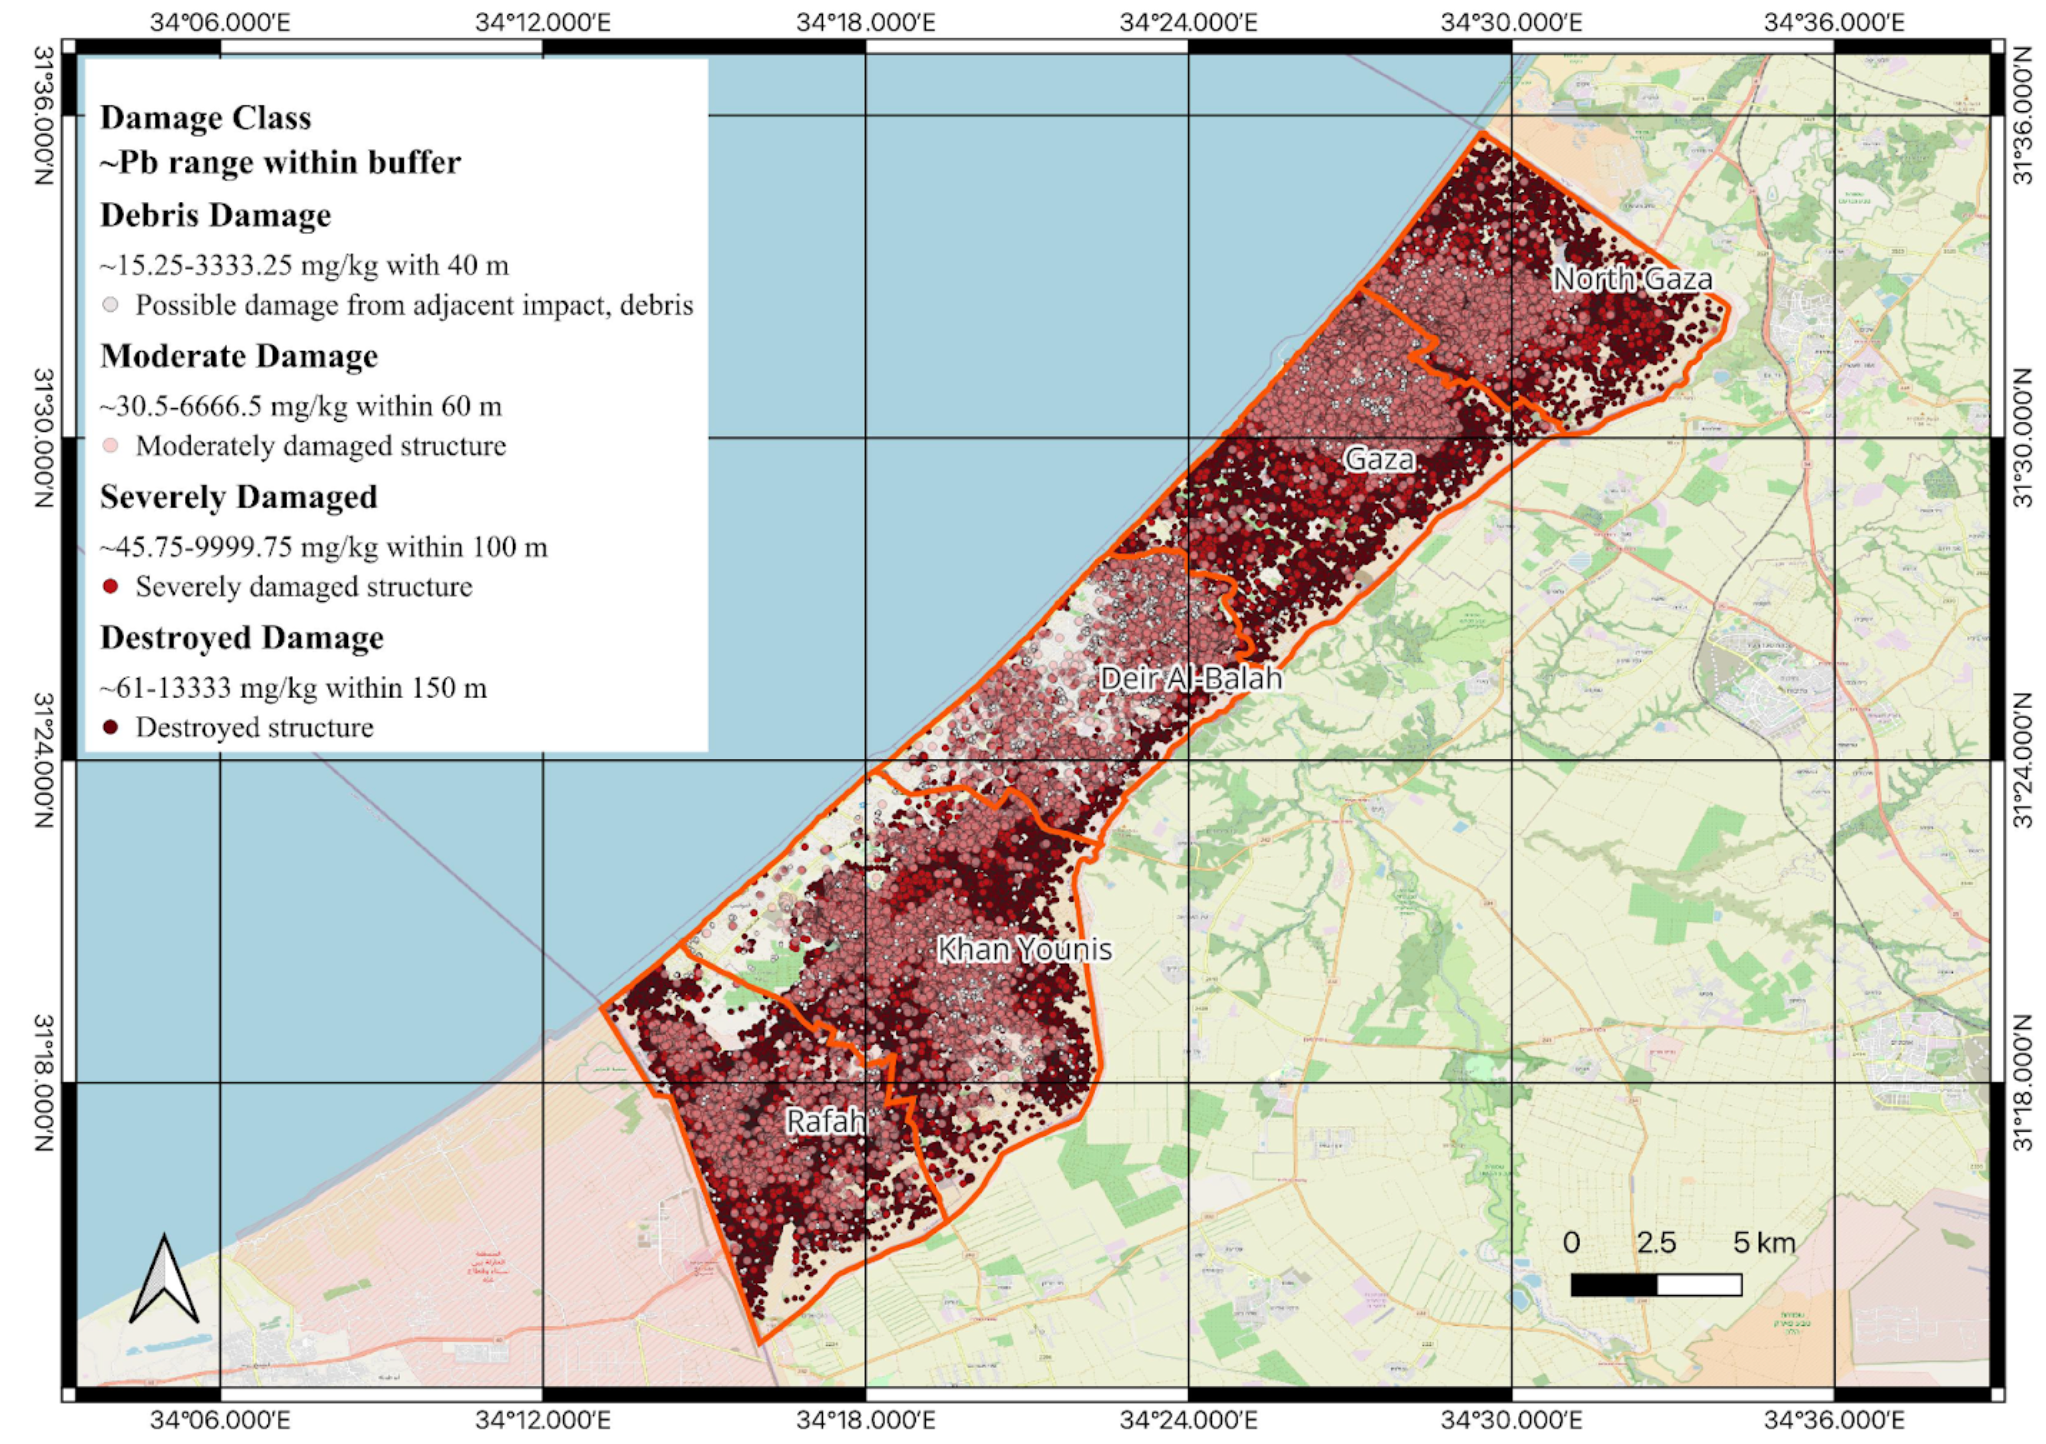
Gaza · modeled lead estimates
Gaza: modeling potential lead dispersal
Modeled lead concentration ranges by structural damage class. Model and map by Carrie A. Shuster. Values are estimates, not field measurements.
Research in progress. Building-damage dataset and assessment date pending verification. The buffers represent model assumptions; the map does not establish measured contamination or individual exposure.
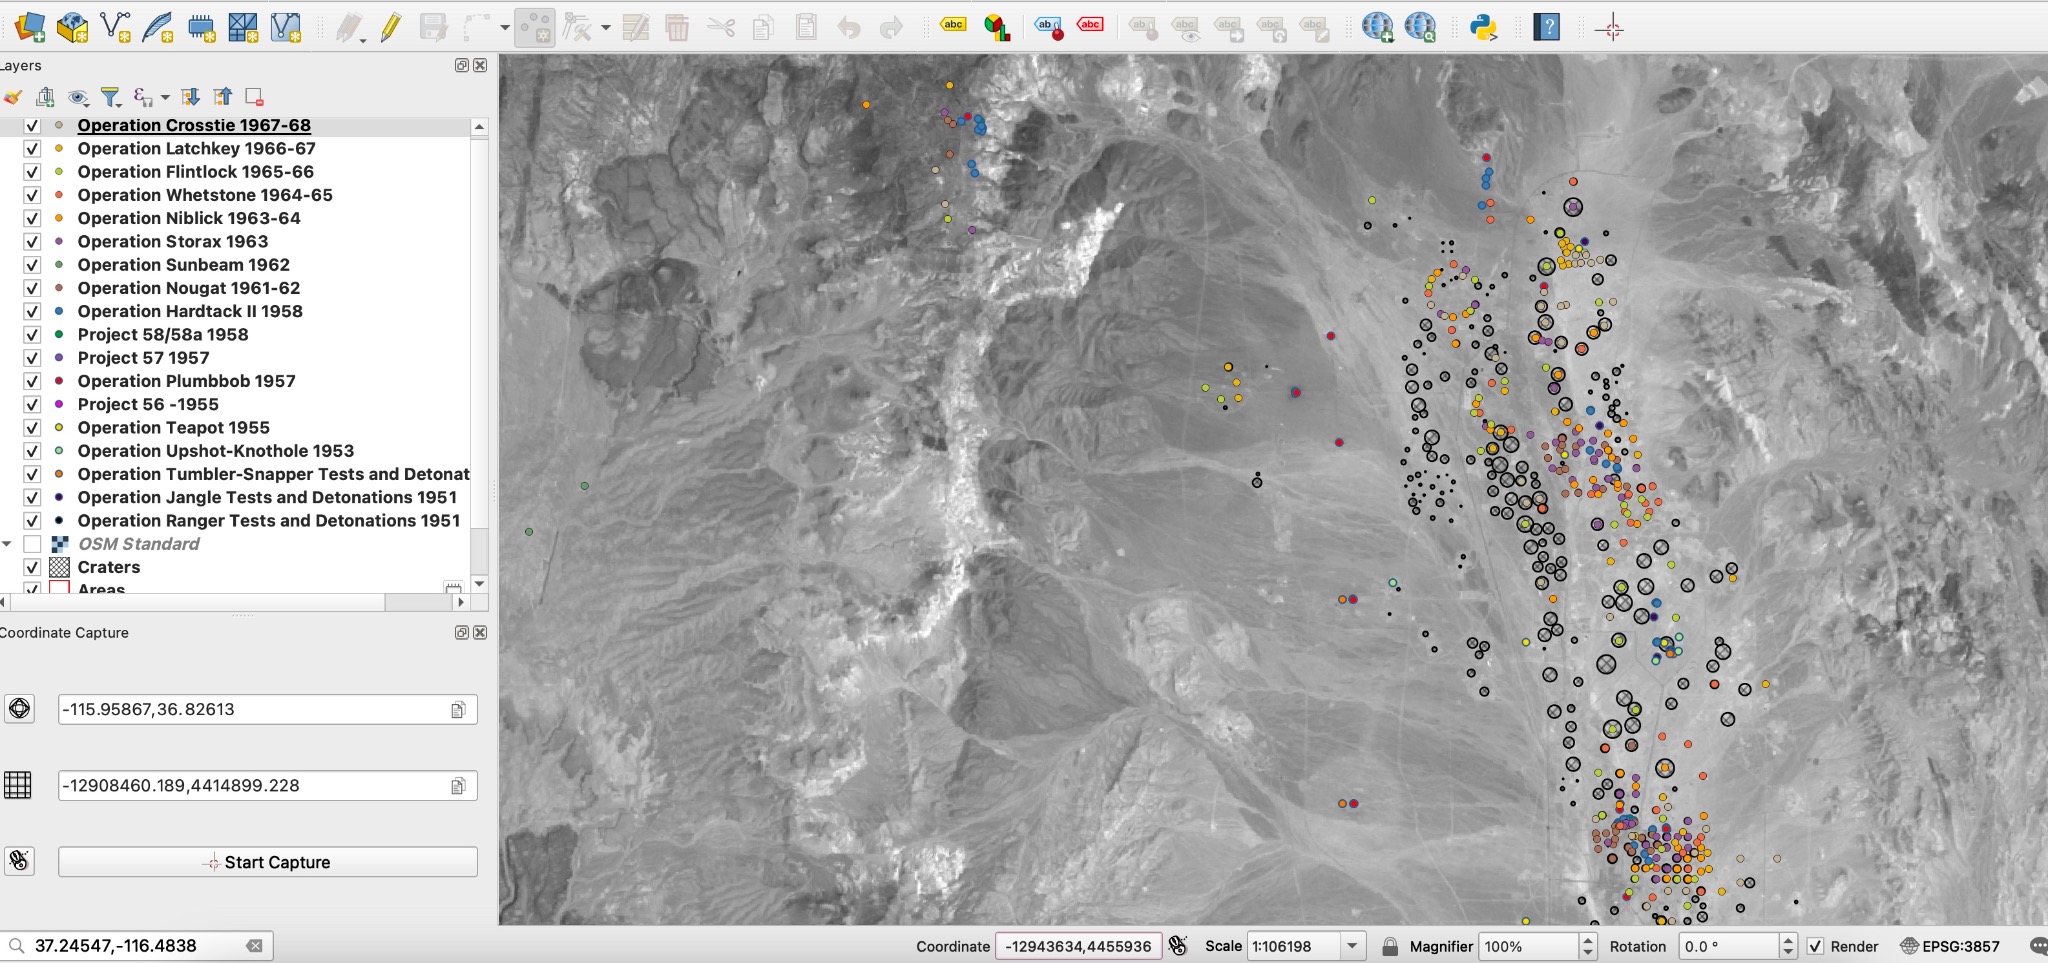
GIS mapping of historical nuclear-test locations and craters. Research screenshot supplied by Carrie A. Shuster.
Research in progress. This screenshot shows spatial context, not measured radiation or contaminant concentrations. Dataset references and mapping date are not yet documented here.
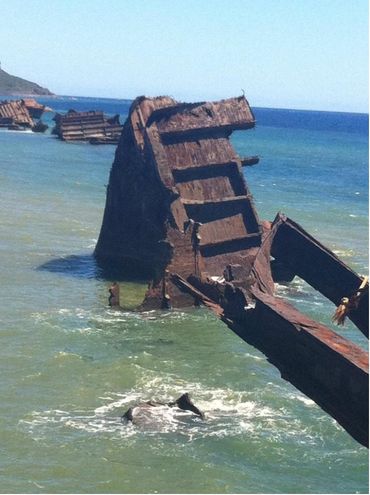
Coastal wreckage · photograph supplied by Carrie A. Shuster
LANDSCAPES / MATERIAL LEGACIES
What remains becomes part of the landscape.
A visible remnant is a starting point for investigation.
Environmental research asks what materials remain, how they interact with their surroundings, and what measurements can establish about their effects. A photograph records the visible landscape; chemical composition and exposure require further evidence.
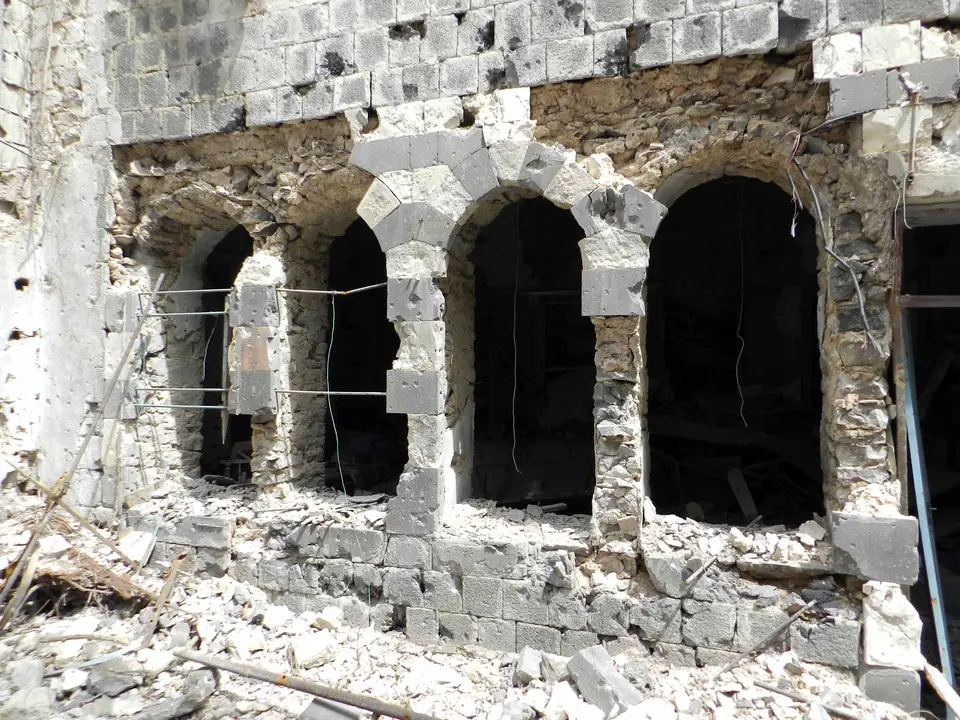
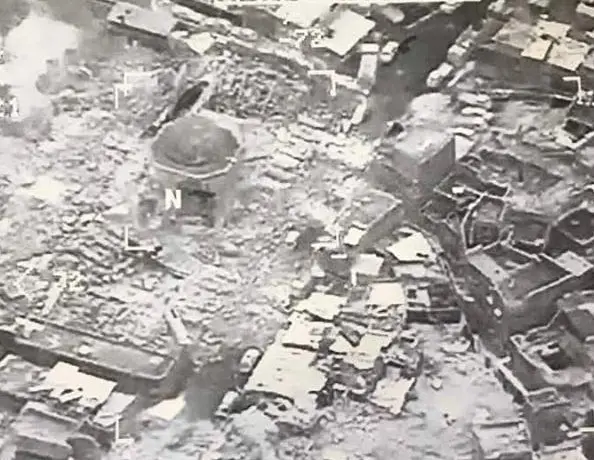
Homs (2012) and Mosul (2017) are historical context photographs. They depict different sites from Syria’s Orontes water assessment and Iraq’s oil-pollution case. Web display copies are resized and compressed with the complete frame retained; visible damage does not establish chemical contamination.
ANATOMY OF THE AFTERMATH / INTERACTIVE FIELD GUIDE
The impact ends. The pathways continue.
Explore five parts of a coastal landscape. Choose a marker to follow a question from a damaged system to the evidence we need.
CONCEPTUAL ILLUSTRATION An imagined landscape—not a real location, damage map, or simulation. Connections are possible pathways, not measured outcomes.
┄→ Dashed marks highlight the selected question. They are illustrative connections, not observed transport, measured extent, or sampling locations.
01 / WATER
What happens when treatment and power fail?
Water services depend on connected systems: power, pumps, treatment, pipes, supplies and maintenance. Damage to one part raises questions about supply and possible pollution pathways.
Power or treatment disruption → service interruption → water-quality questions
FOLLOW A REAL CASE
Gaza · water and sanitation
The September 2025 UNEP assessment describes likely aquifer and coastal pollution pathways. Coastal testing was not possible.
Evidence: assessed pathways · not site-level concentration measurements