Retained beach sand
The paper reports collection between 2003 and 2010 from the top three inches of beach surface material, followed by storage and analysis in 2023.
These are historical samples, not a present-day island-wide survey.
RESEARCH / IWO JIMA / PUBLISHED STUDY
What can Invasion Beach sand tell us about warfare’s environmental legacy?
Carrie A. Shuster’s published study examines metals in retained sand samples from Iwo Jima’s Invasion Beach. It asks how those measurements compare with published volcanic-soil data—and what they can tell us about a landscape shaped by military activity.
Read the published paper ↗Environmental Forensics · 26(3), 393–411 · 2025
First published online 2 December 2024
Measured · Modeled · Reported · Unknown — read the evidence labels ↗
THE PUBLISHED FINDING
The paper reports higher mercury and lower chromium in retained Iwo Jima sand compared with published volcanic-soil data. Those comparisons identify questions for further investigation; they do not establish local background, wartime origins or exposure.
Summary of the published article, pp. 396–399. Publication and DOI ↓
PUBLISHED COMPARISONS / FIVE ELEMENTS
These categories summarize statistical comparisons, not metal concentrations or the size of an effect.
Reported-result summary checked against the original published Methodology, Table 2 and Results, pp. 396–399 on 22 October 2026. Categories show reported comparisons, not concentrations, effect sizes or a new analysis. Publication and DOI ↗
MEASURED / AUTHOR-SUPPLIED XRF AVERAGES
Lead and zinc vary across the three supplied AVG columns. These charts show the reported values as supplied; they do not establish why the columns differ.
Compare values within each element. Each panel uses a different zero-based scale, in mg/kg.
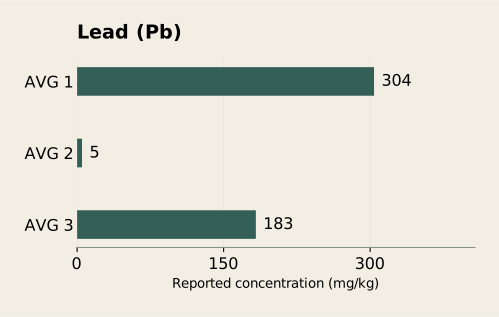
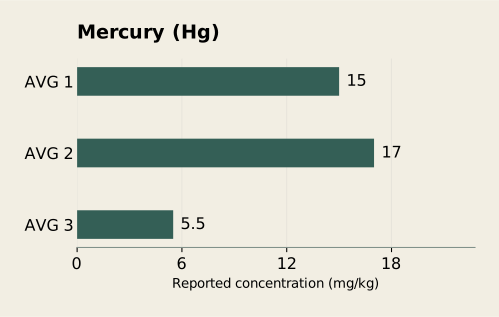
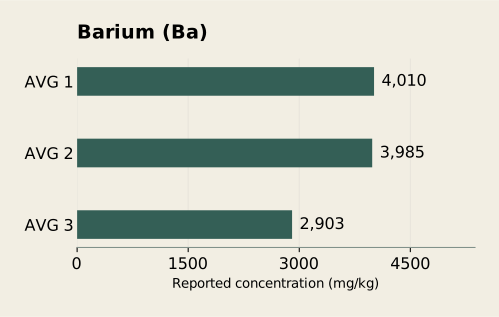
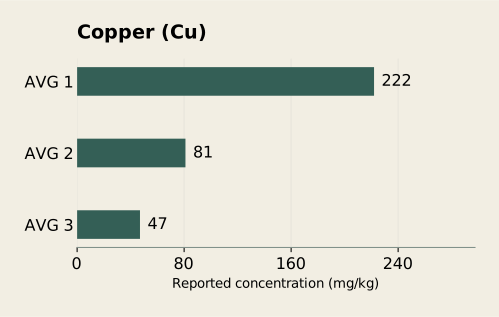
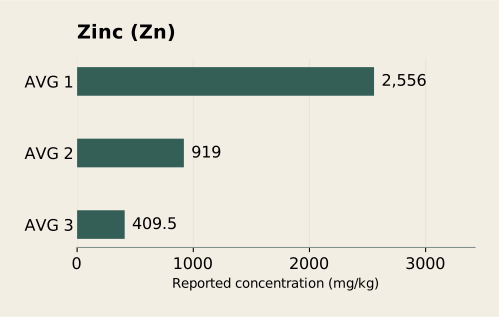
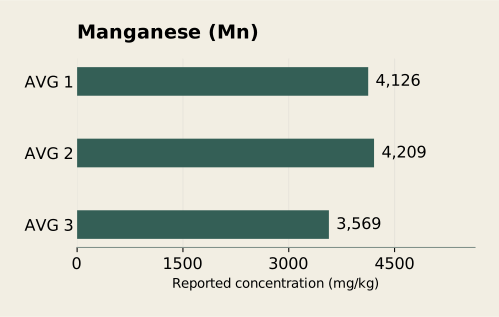
Iron is reported only as >10% in all three columns, so no exact iron bars are drawn. Tank debris and the 38 fragment readings are excluded.
| Element | AVG 1 | AVG 2 | AVG 3 |
|---|---|---|---|
| Lead | 304 | 5 | 183 |
| Mercury | 15 | 17 | 5.5 |
| Barium | 4010 | 3985 | 2903 |
| Copper | 222 | 81 | 47 |
| Zinc | 2556 | 919 | 409.5 |
| Manganese | 4126 | 4209 | 3569 |
Source: the author-supplied elemental table reproduced in the additional XRF records. The 2008–2010 labels do not independently establish scan dates. These AVG labels have not been matched to the five published samples or the fragment records.
Original zeros represent nondetections, not elemental absence. All six plotted rows have positive supplied averages; their underlying nondetection averaging rules remain unresolved. Values are not recalculated or substituted. No error bars, significance tests or regulatory thresholds are inferred.
Download these plotted values (CSV) ↓Descriptive display of supplied records, not a new statistical analysis. See how the record sets differ ↓
THE PLACE / THE MATERIAL / THE QUESTION
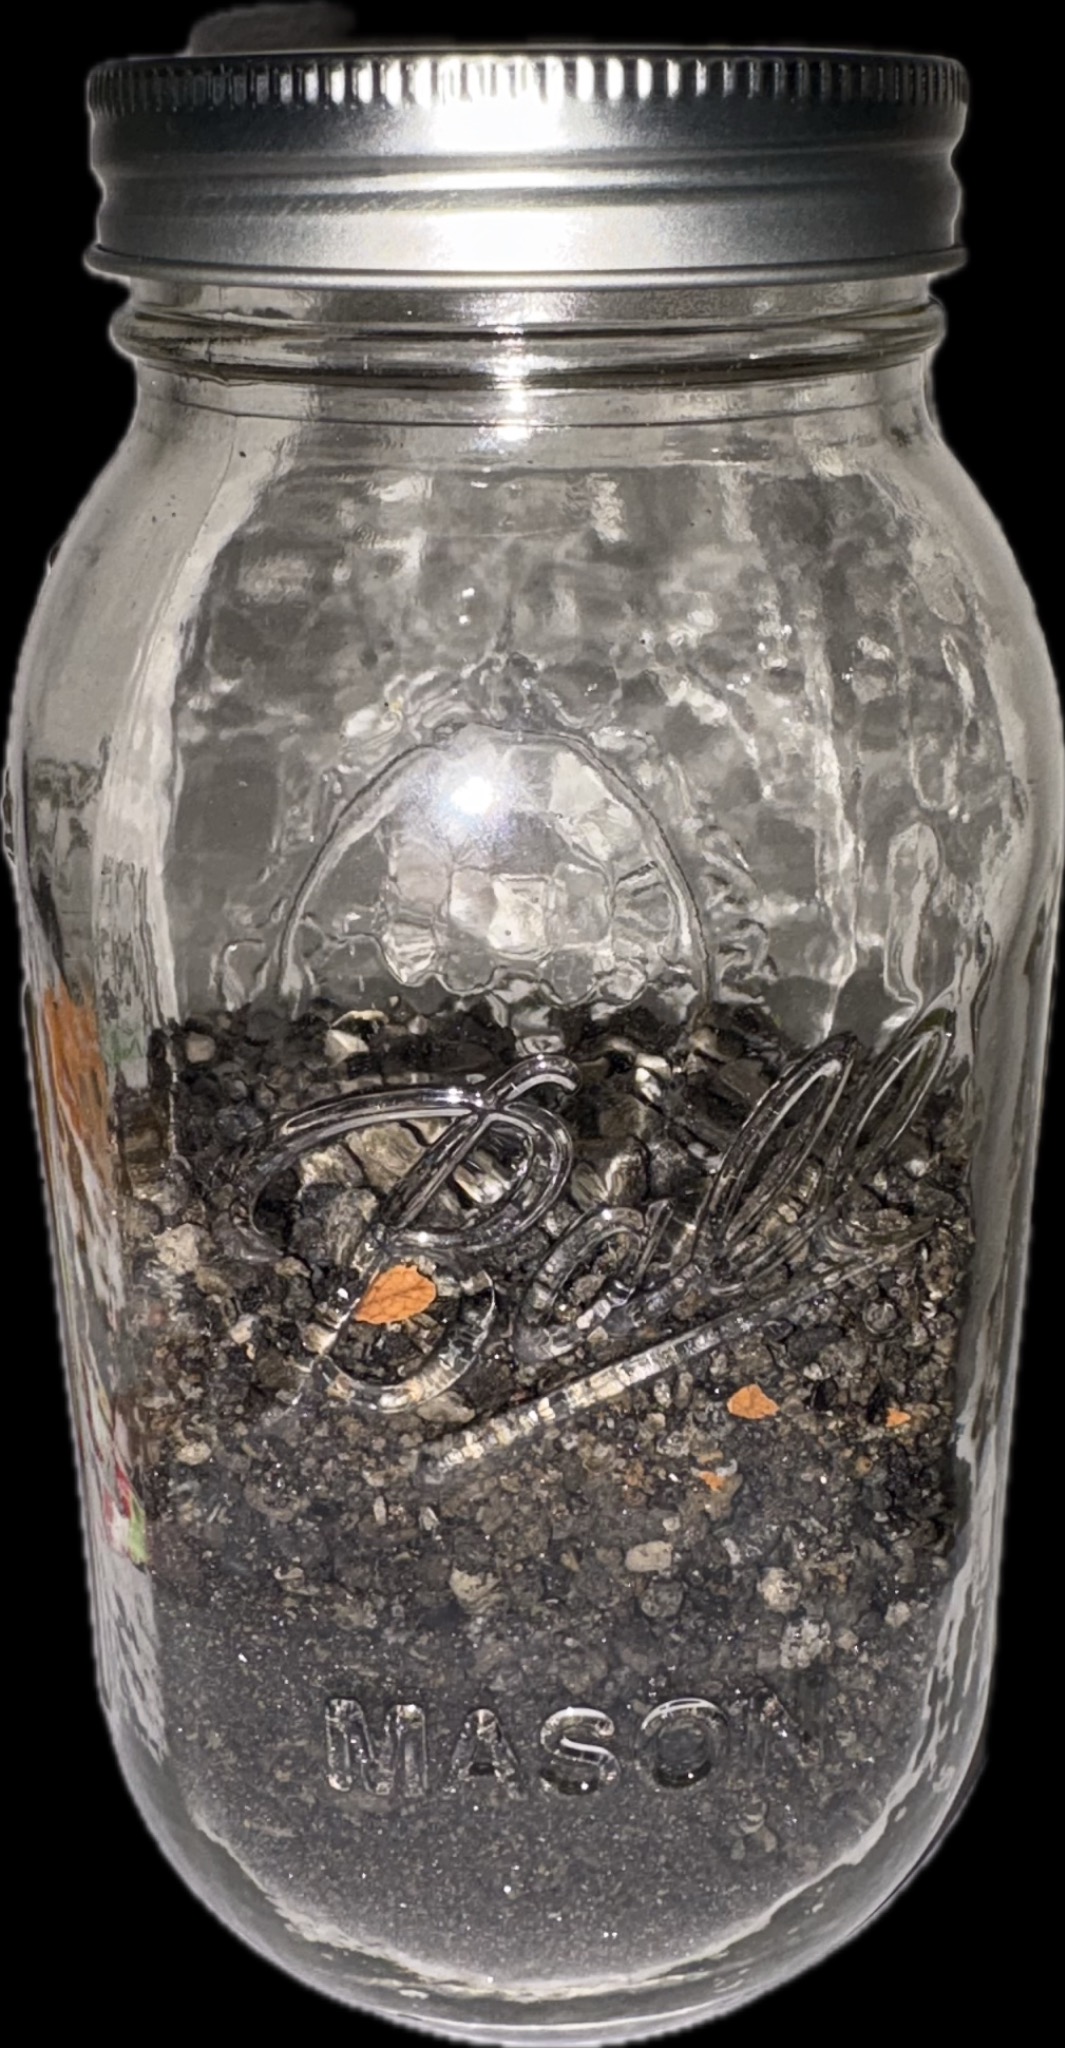
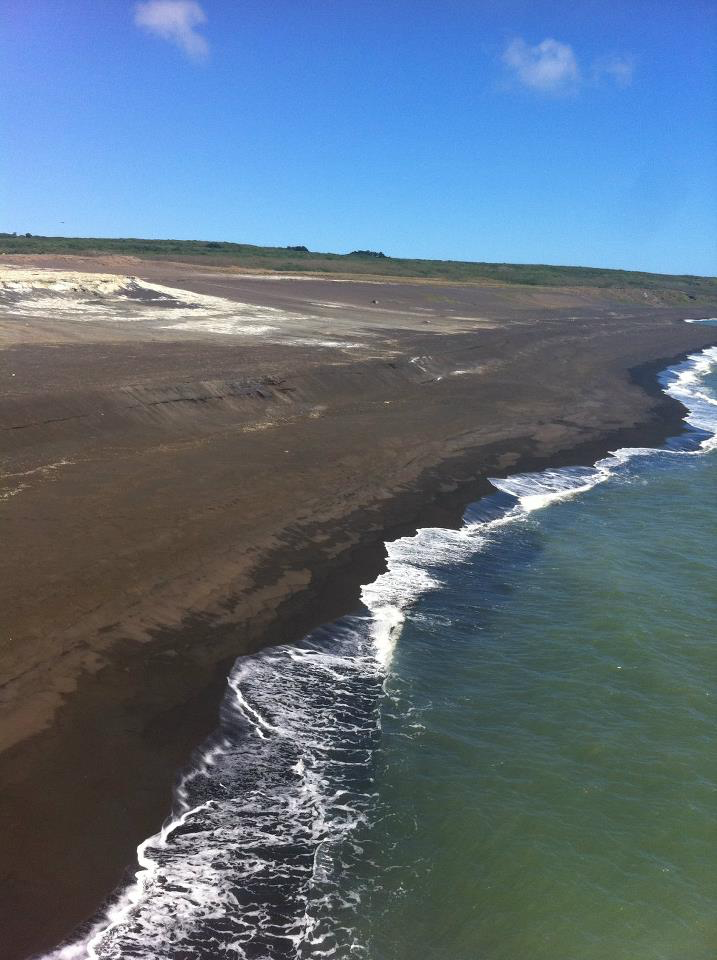
A jar preserves a connection to a place. Analysis asks what else it contains.
These photographs connect the retained sand to the landscape behind the research. The next step is measurement: identifying elements in the analyzed material, then testing what those results can—and cannot—tell us about its history.
See what the XRF records report ↓
These supplied images place the research in historical context. Map overlays are illustrative: alignment, scale and original archival references have not been verified for spatial analysis.
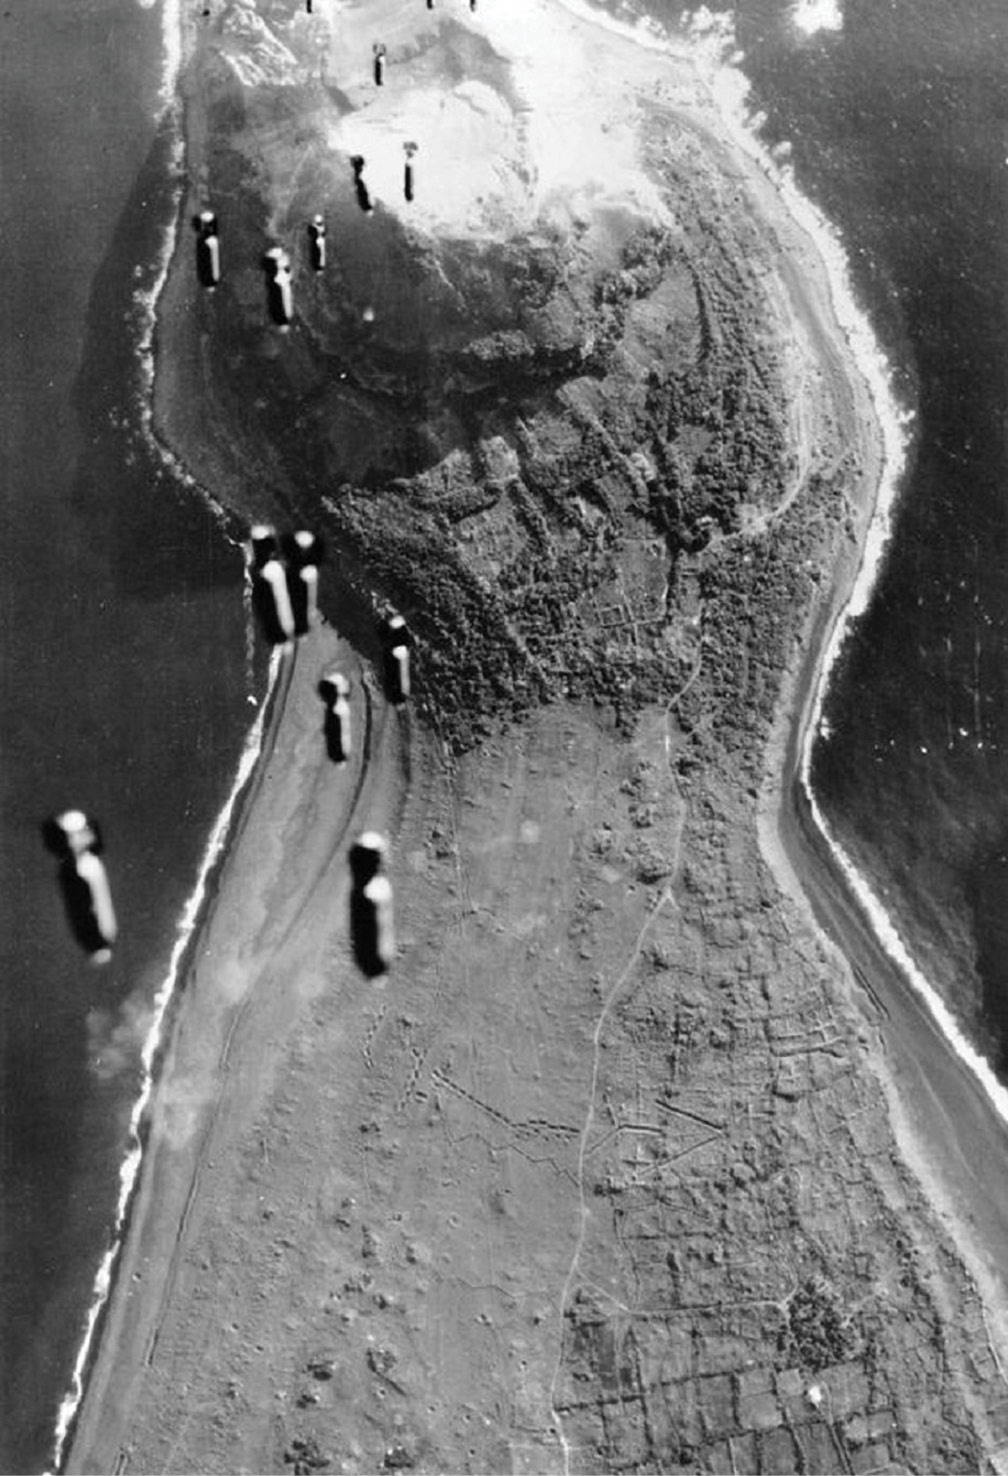
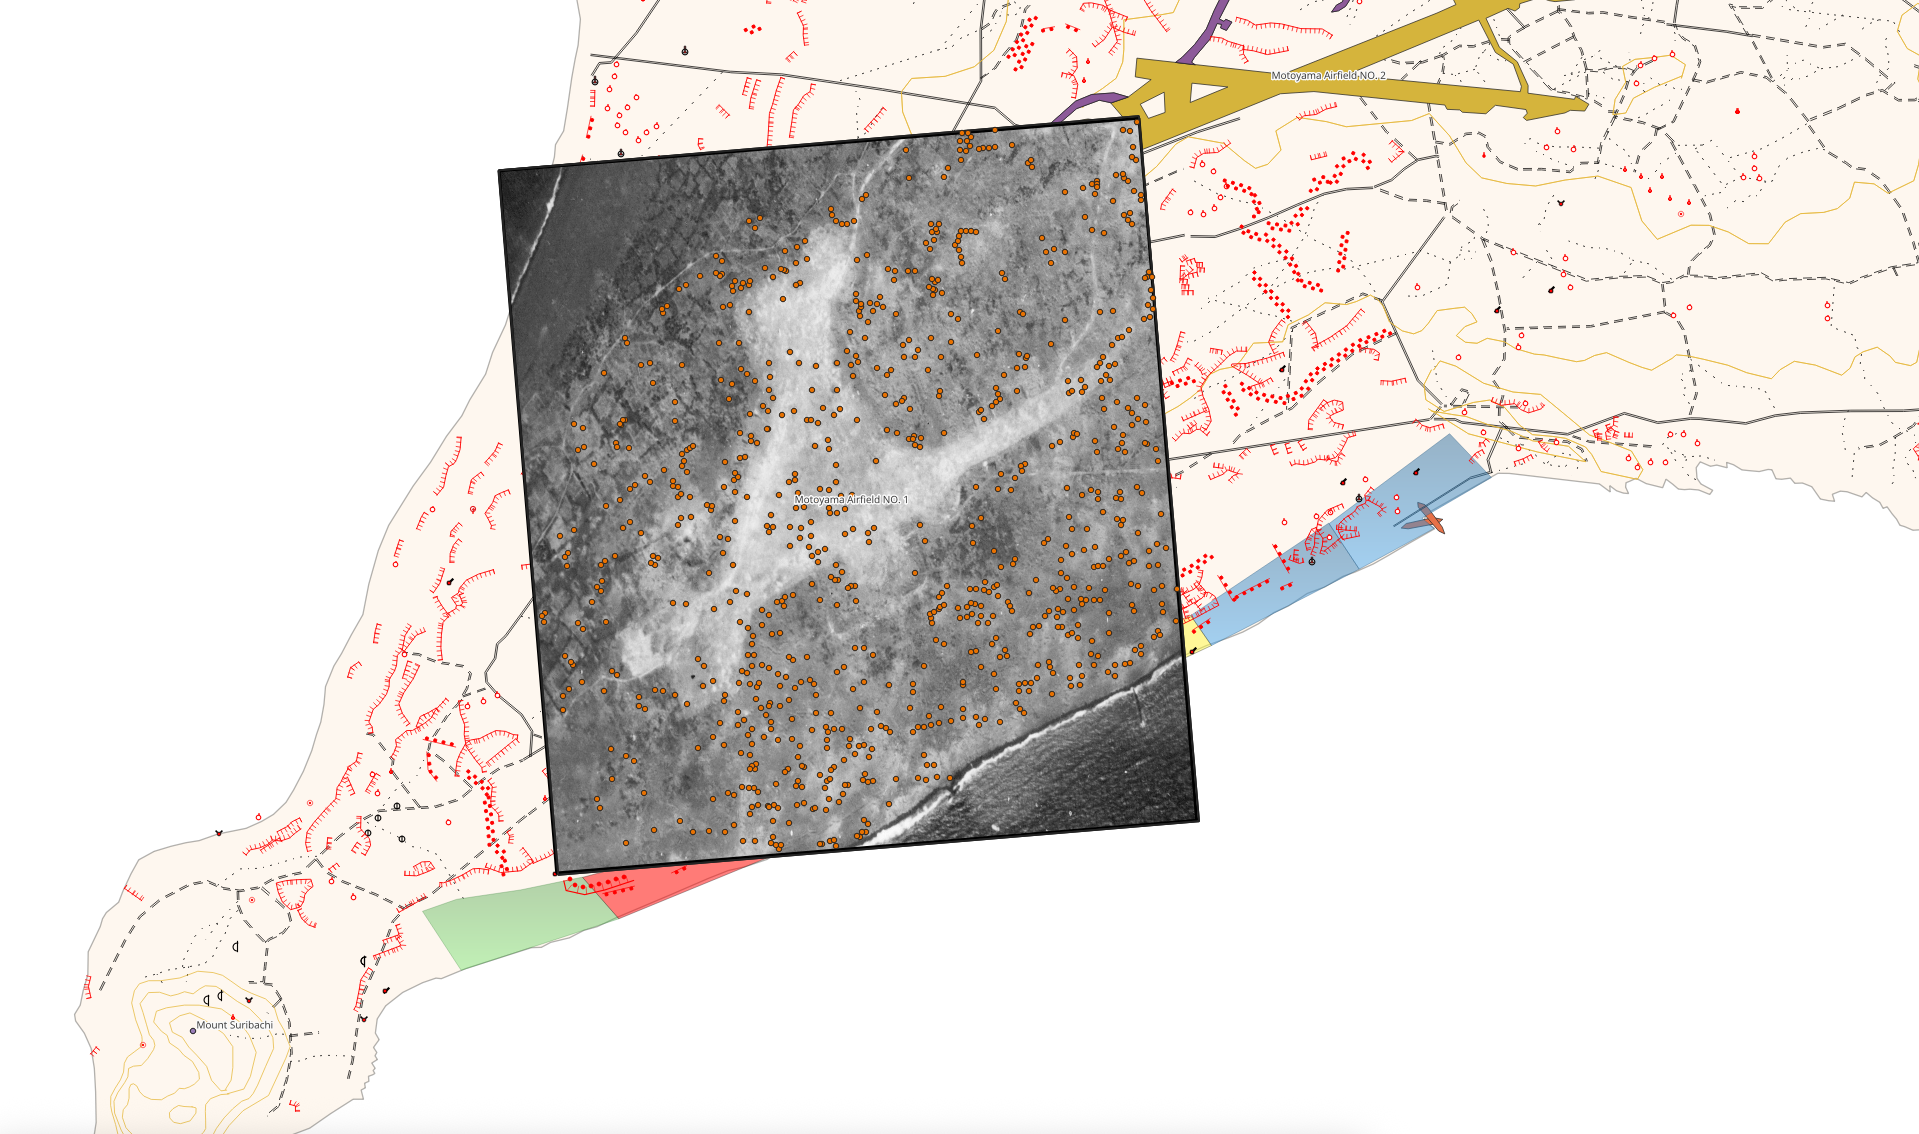
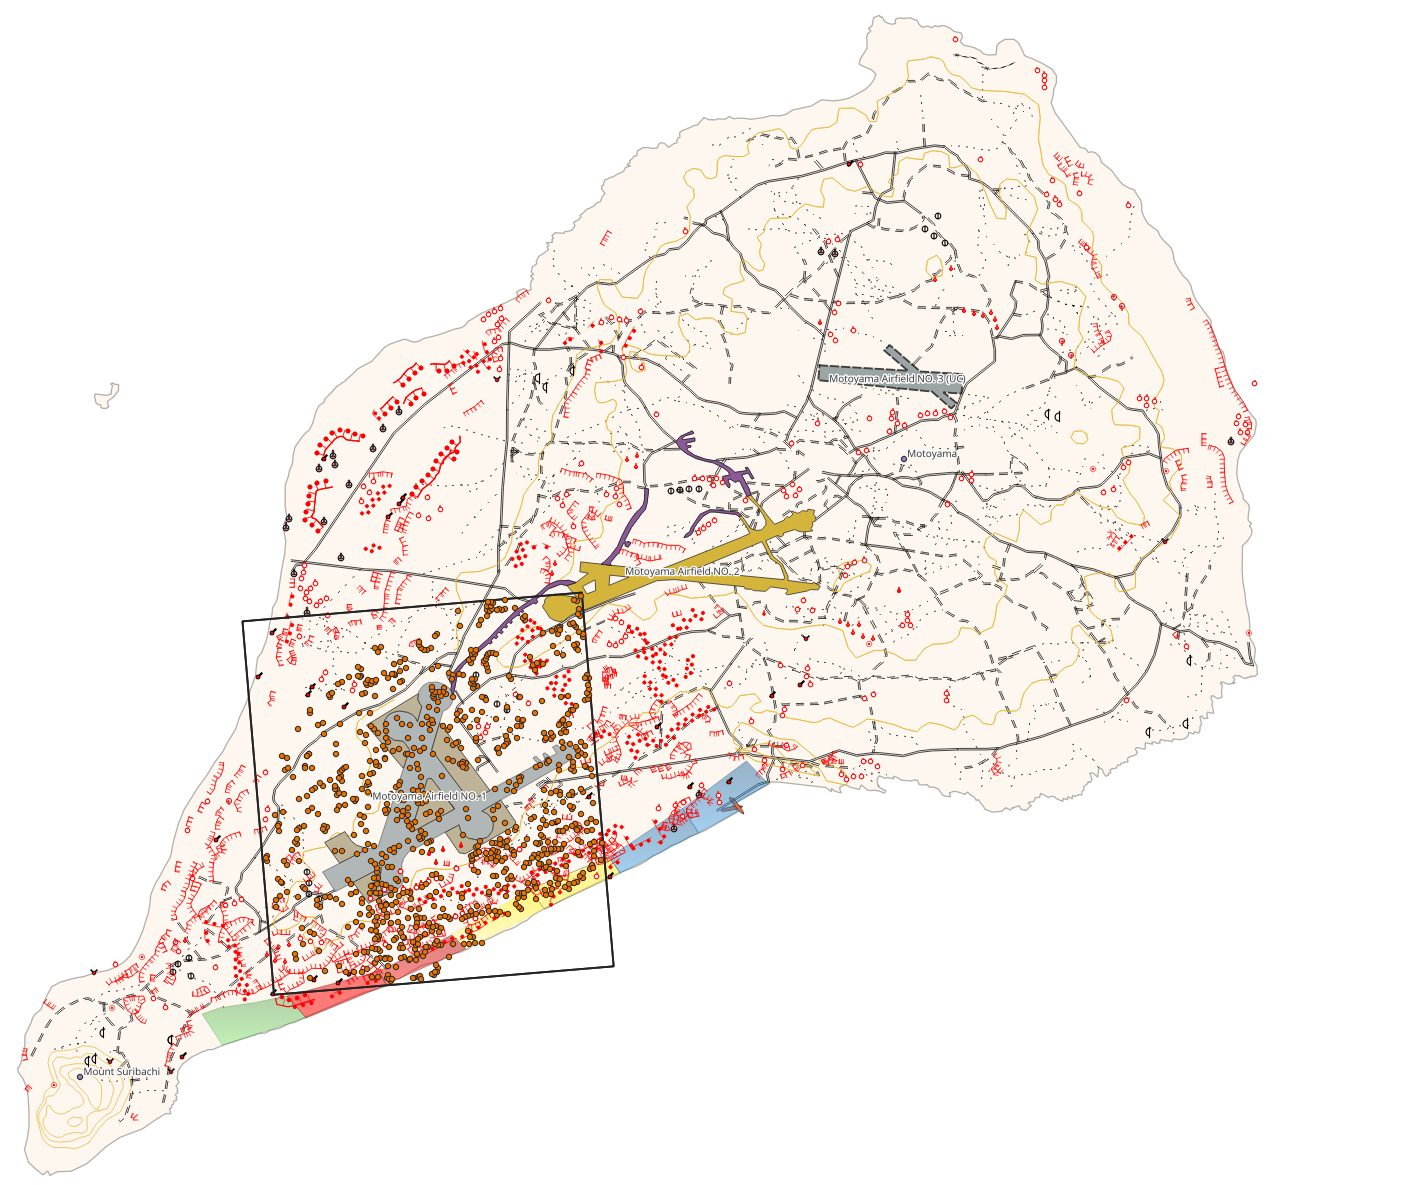
Images supplied for this site on 23 October 2026. Original files are displayed without added objects or altered features.
AUTHOR-REPORTED STRUCTURE / RECORD MATCHING INCOMPLETE
4 samples
1 sample
The author describes four separate analytical portions per sample. Four samples came from one container and one from the other. The author reports no cross-contamination. A/B and sample numbers here are diagram labels, not original laboratory identifiers.
Author clarification supplied 22 October 2026, supplementing the published methods (pp. 396–397). Analytical portions are not independent field collection locations. Field-location independence and the underlying analytical records still need to be checked before calculating uncertainty.
These labels do not match the other tables yet. The three averaged datasets, six triplicate groups and 38 fragment records have not been linked to these five samples through original laboratory identifiers. Do not pool their counts or infer that a table’s “Sample 1” is Sample 1 in this diagram. Compare the four record sets ↓
Comparison figure pending: original results and comparison tables must be reconciled before plotting between-group effects or error bars. The separate descriptive chart reproduces only the three supplied AVG columns.
BEFORE THE NUMBERS / A GUIDE TO THE RECORDS
The counts below describe different kinds of records. They must not be added together as a total number of independent samples. This guide organizes the existing evidence; it does not resolve missing laboratory identifiers.
| Record set | What the count means | Used here for | Unresolved connection |
|---|---|---|---|
| Published sand study | Five samples from two containers; four separate portions per sample, according to the author. | Sampling diagram and published comparisons. | Original laboratory IDs have not been matched to the diagram. Analytical portions are not independent field locations. |
| Three supplied averages | Three columns labeled Sample 1–3 AVG, 2008–2010. | Selected concentration ranges; tank debris excluded. | The labels do not establish scan dates or correspondence with the five published samples. ND averaging rules remain unresolved. |
| 38 numbered fragment records | Individual numbered metallic-fragment measurements. | Fragment explorer, kept separate from the averages. | Record-level matching is needed before combining them with other datasets. |
| Six reported triplicate groups | Six groups of three analyses in an additional author-reported table. | Methods reconciliation only; not pooled into the displayed ranges. | Original row IDs, group membership, overlap and averaging rules need confirmation. |
ND means not detected, not absent. Original nondetects were entered as zeros. Treating those zeros as measured values can change an average; the calculation rule must be known before reproducing it.
See recovered methods and outstanding analytical records ↓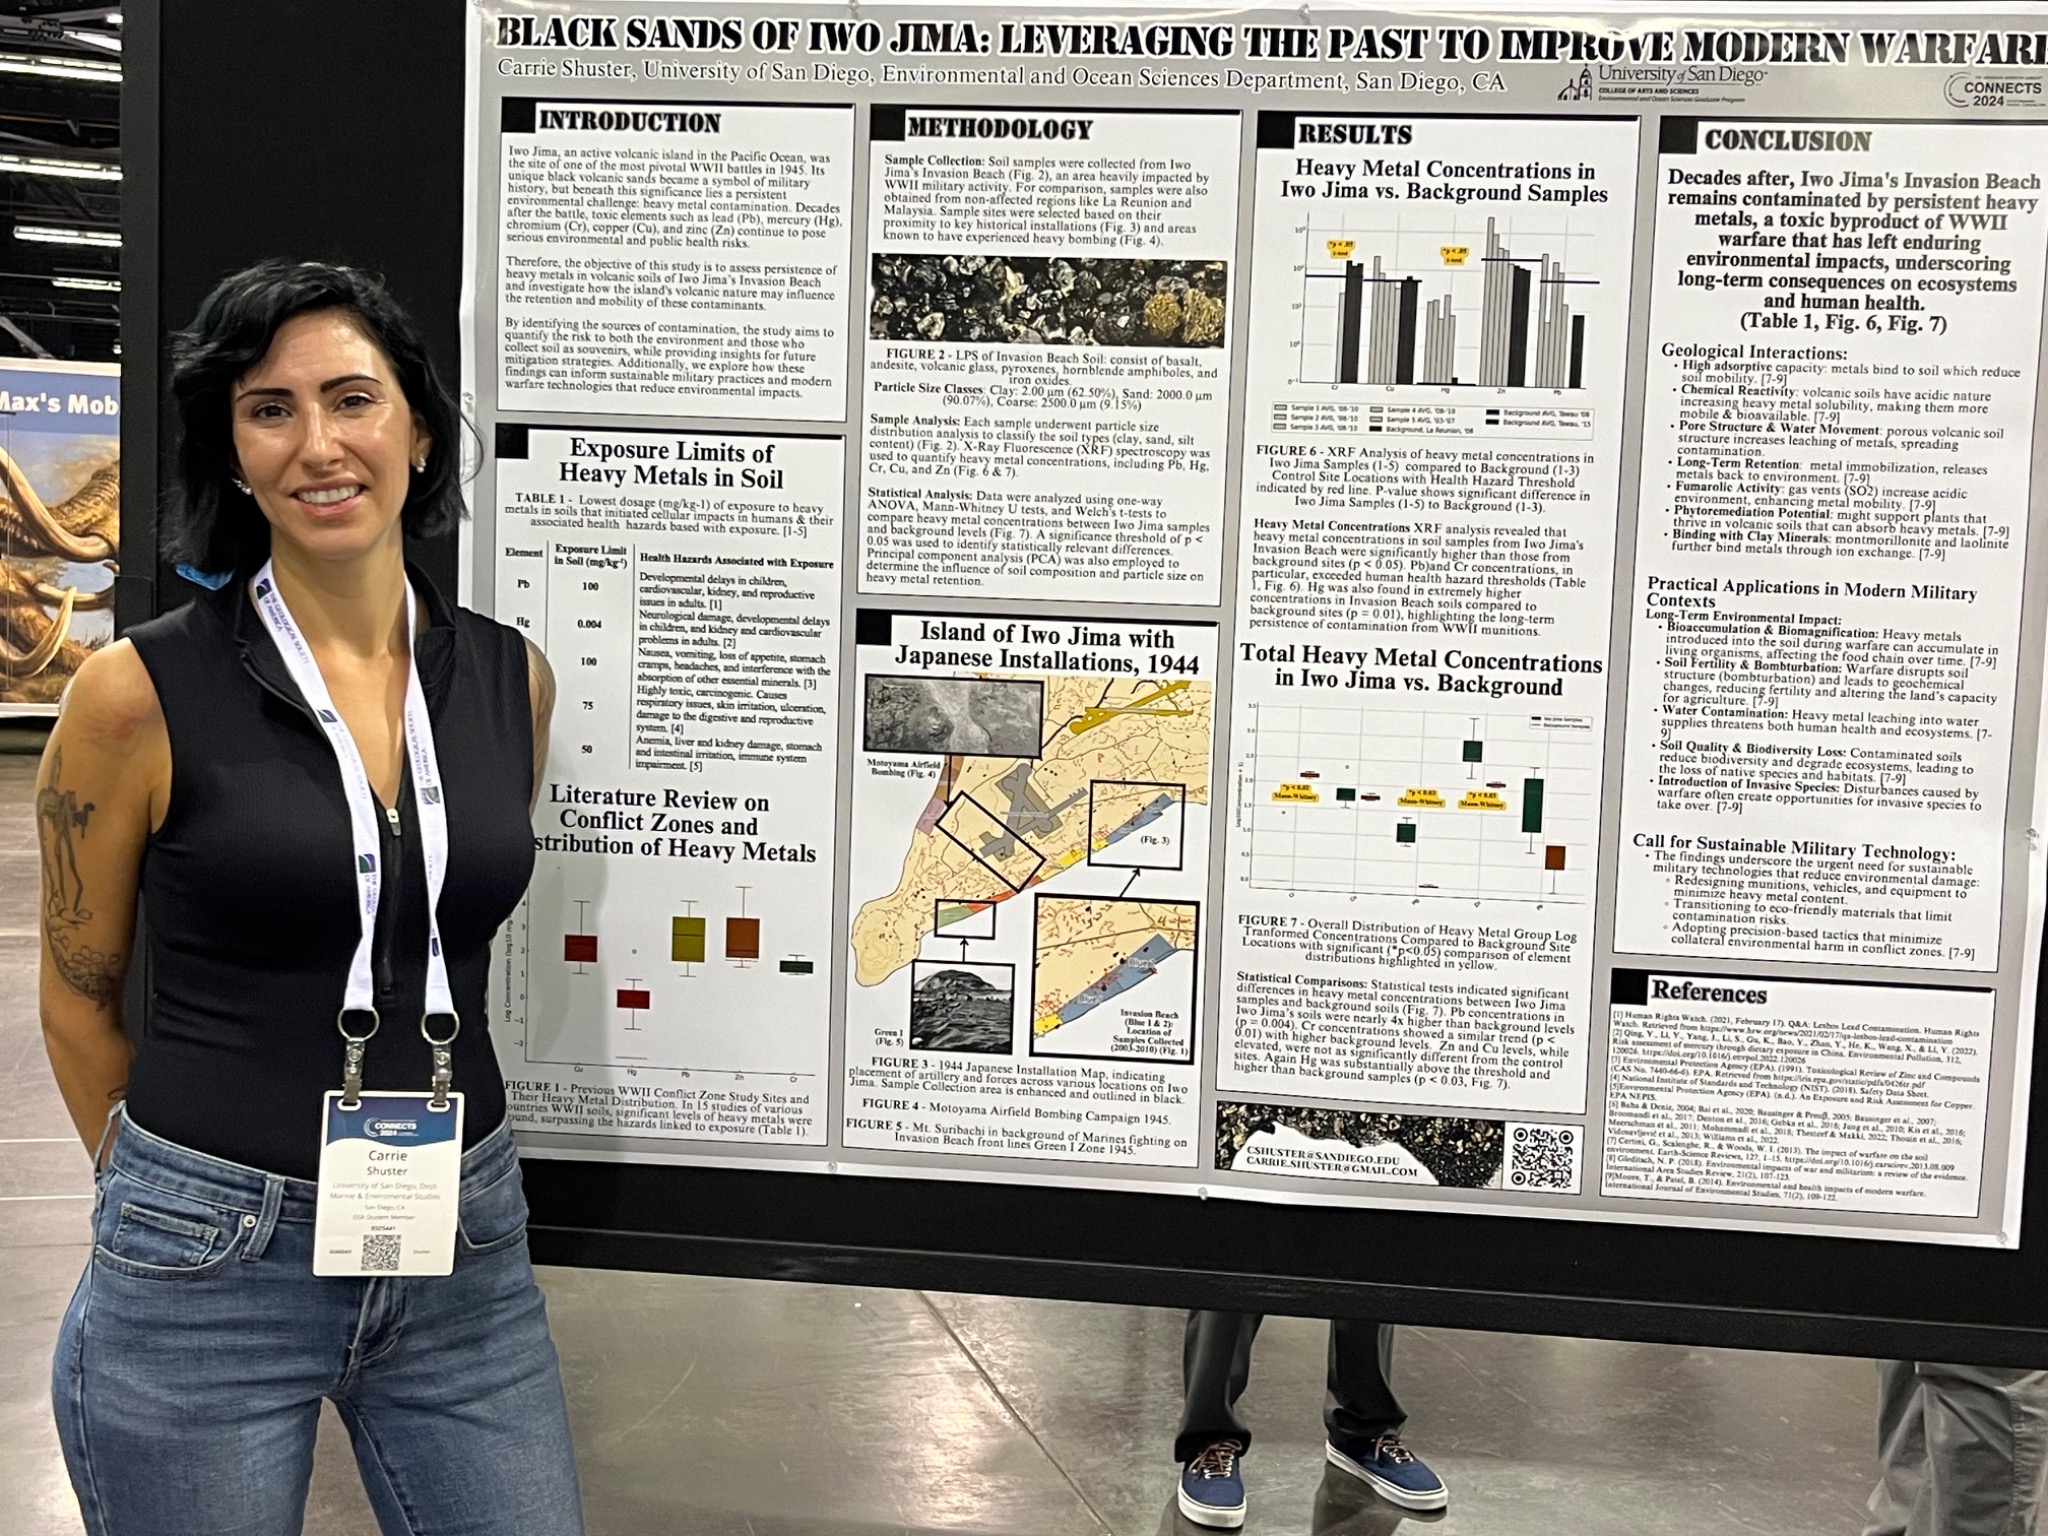
HISTORICAL CONTEXT / MAPS & AERIAL IMAGERY
Historical imagery helps place the research in its geographic setting. Open either image to examine it at full size. Mapped installations and collection annotations do not establish contaminant concentrations or source attribution.
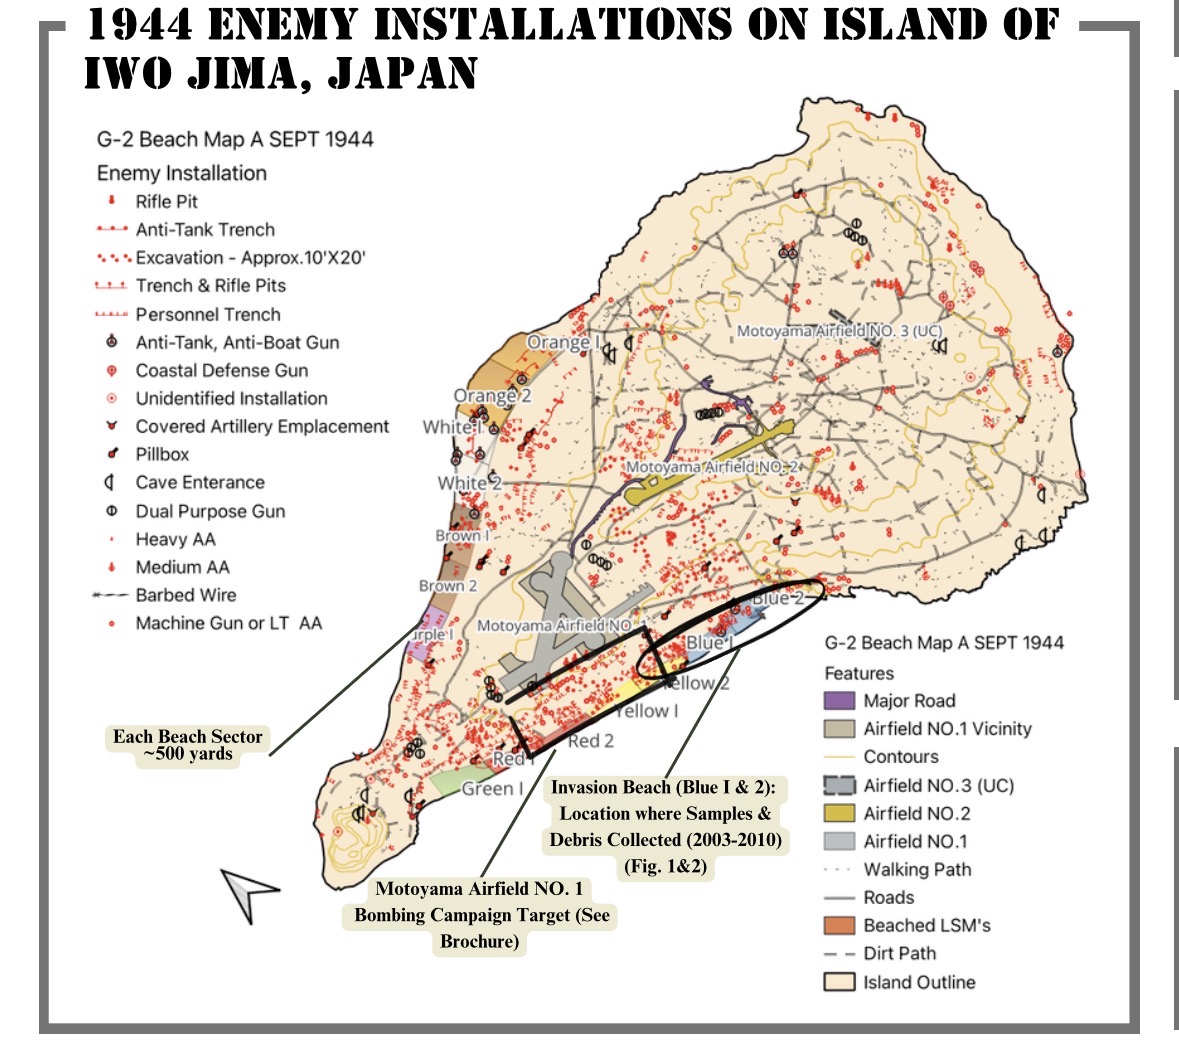
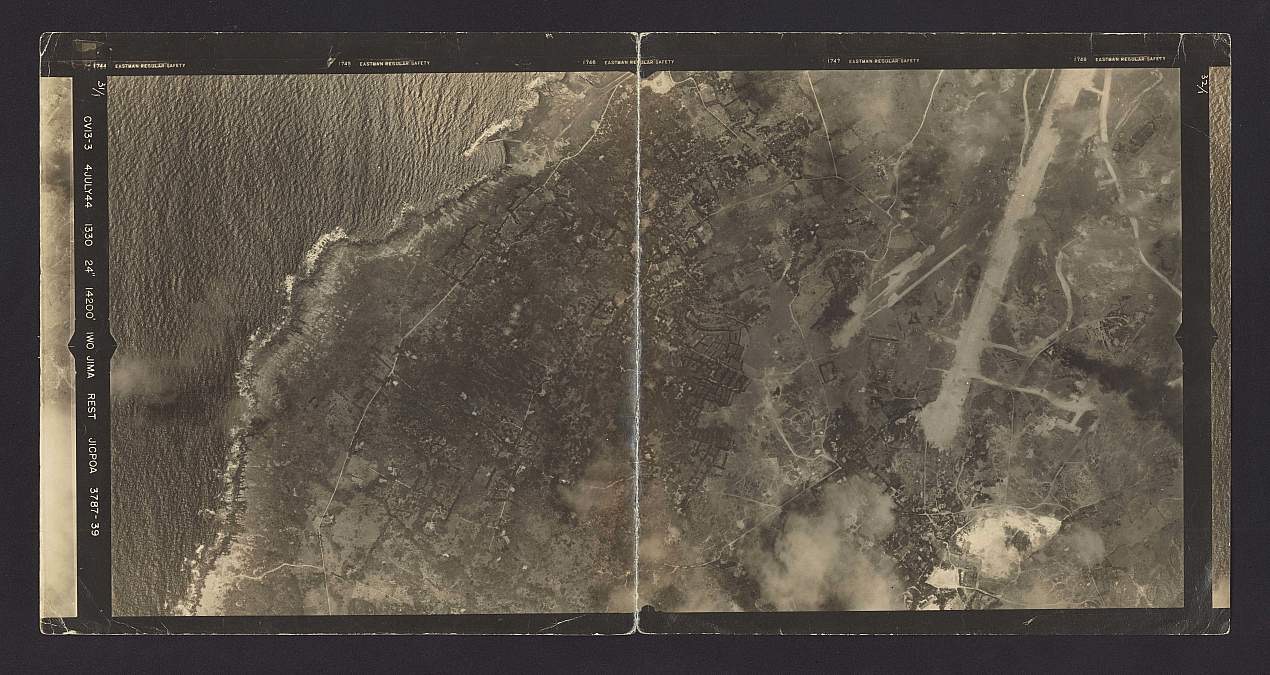
THE QUESTION
The study examined chromium, copper, mercury, lead, and zinc in beach sand.
Invasion Beach was part of the 1945 landing area. Its military history makes it an important setting for investigating environmental legacies, but that history alone cannot establish the source of every measured metal.
The central comparison was between the Iwo Jima samples and volcanic-soil measurements reported in studies from La Réunion and Tawau, Sabah, Malaysia. These were literature-based comparisons from other regions, not matched local control samples.
Source: Methodology, pp. 396–397 ↘THE MATERIAL / ORIGINAL RESEARCH PHOTOGRAPHS
Original photographs supplied by Carrie A. Shuster and identified by her as Iwo Jima sand. Their textures provide context for the analytical work; a photograph cannot identify a metal concentration or establish a wartime source.
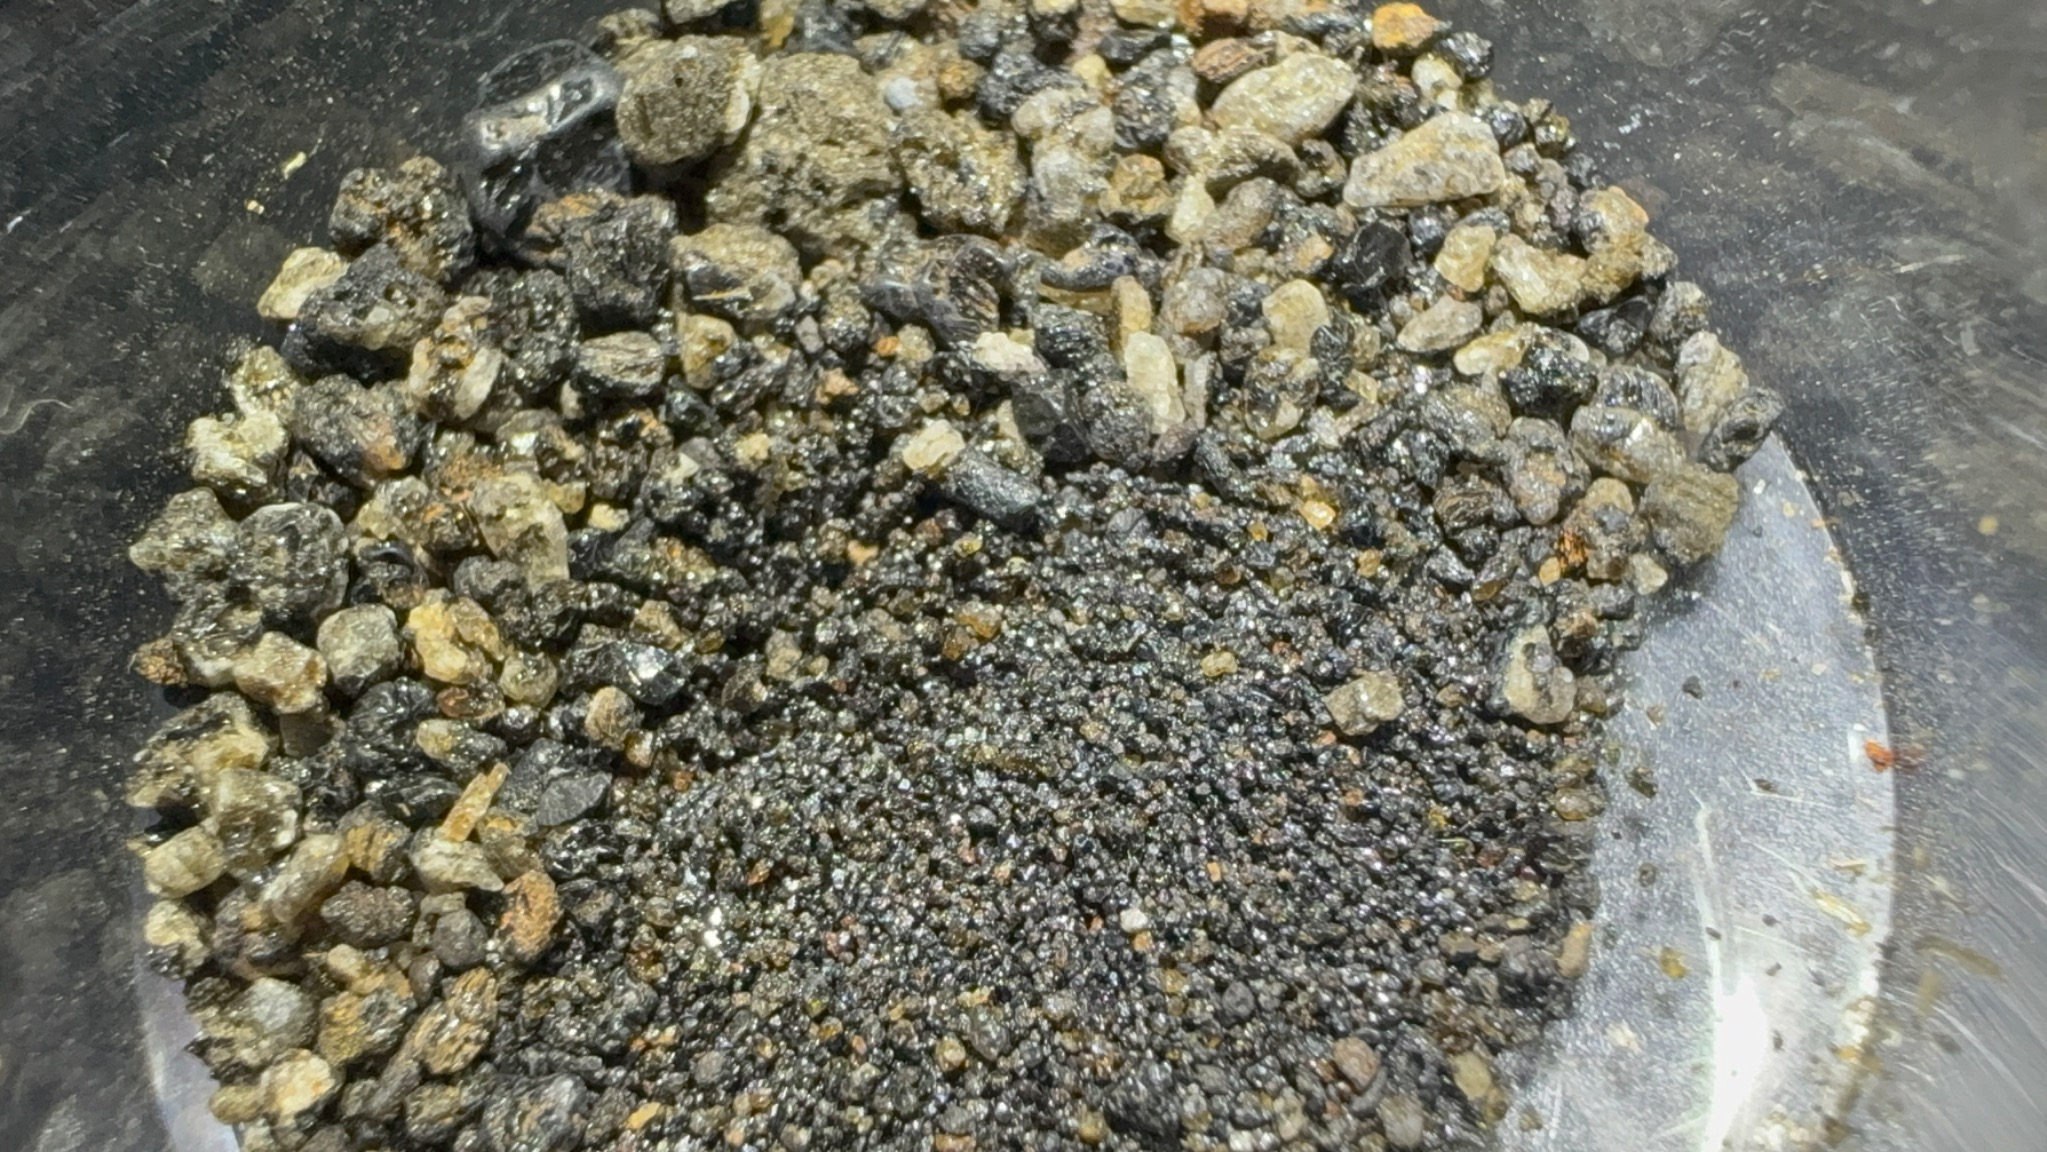
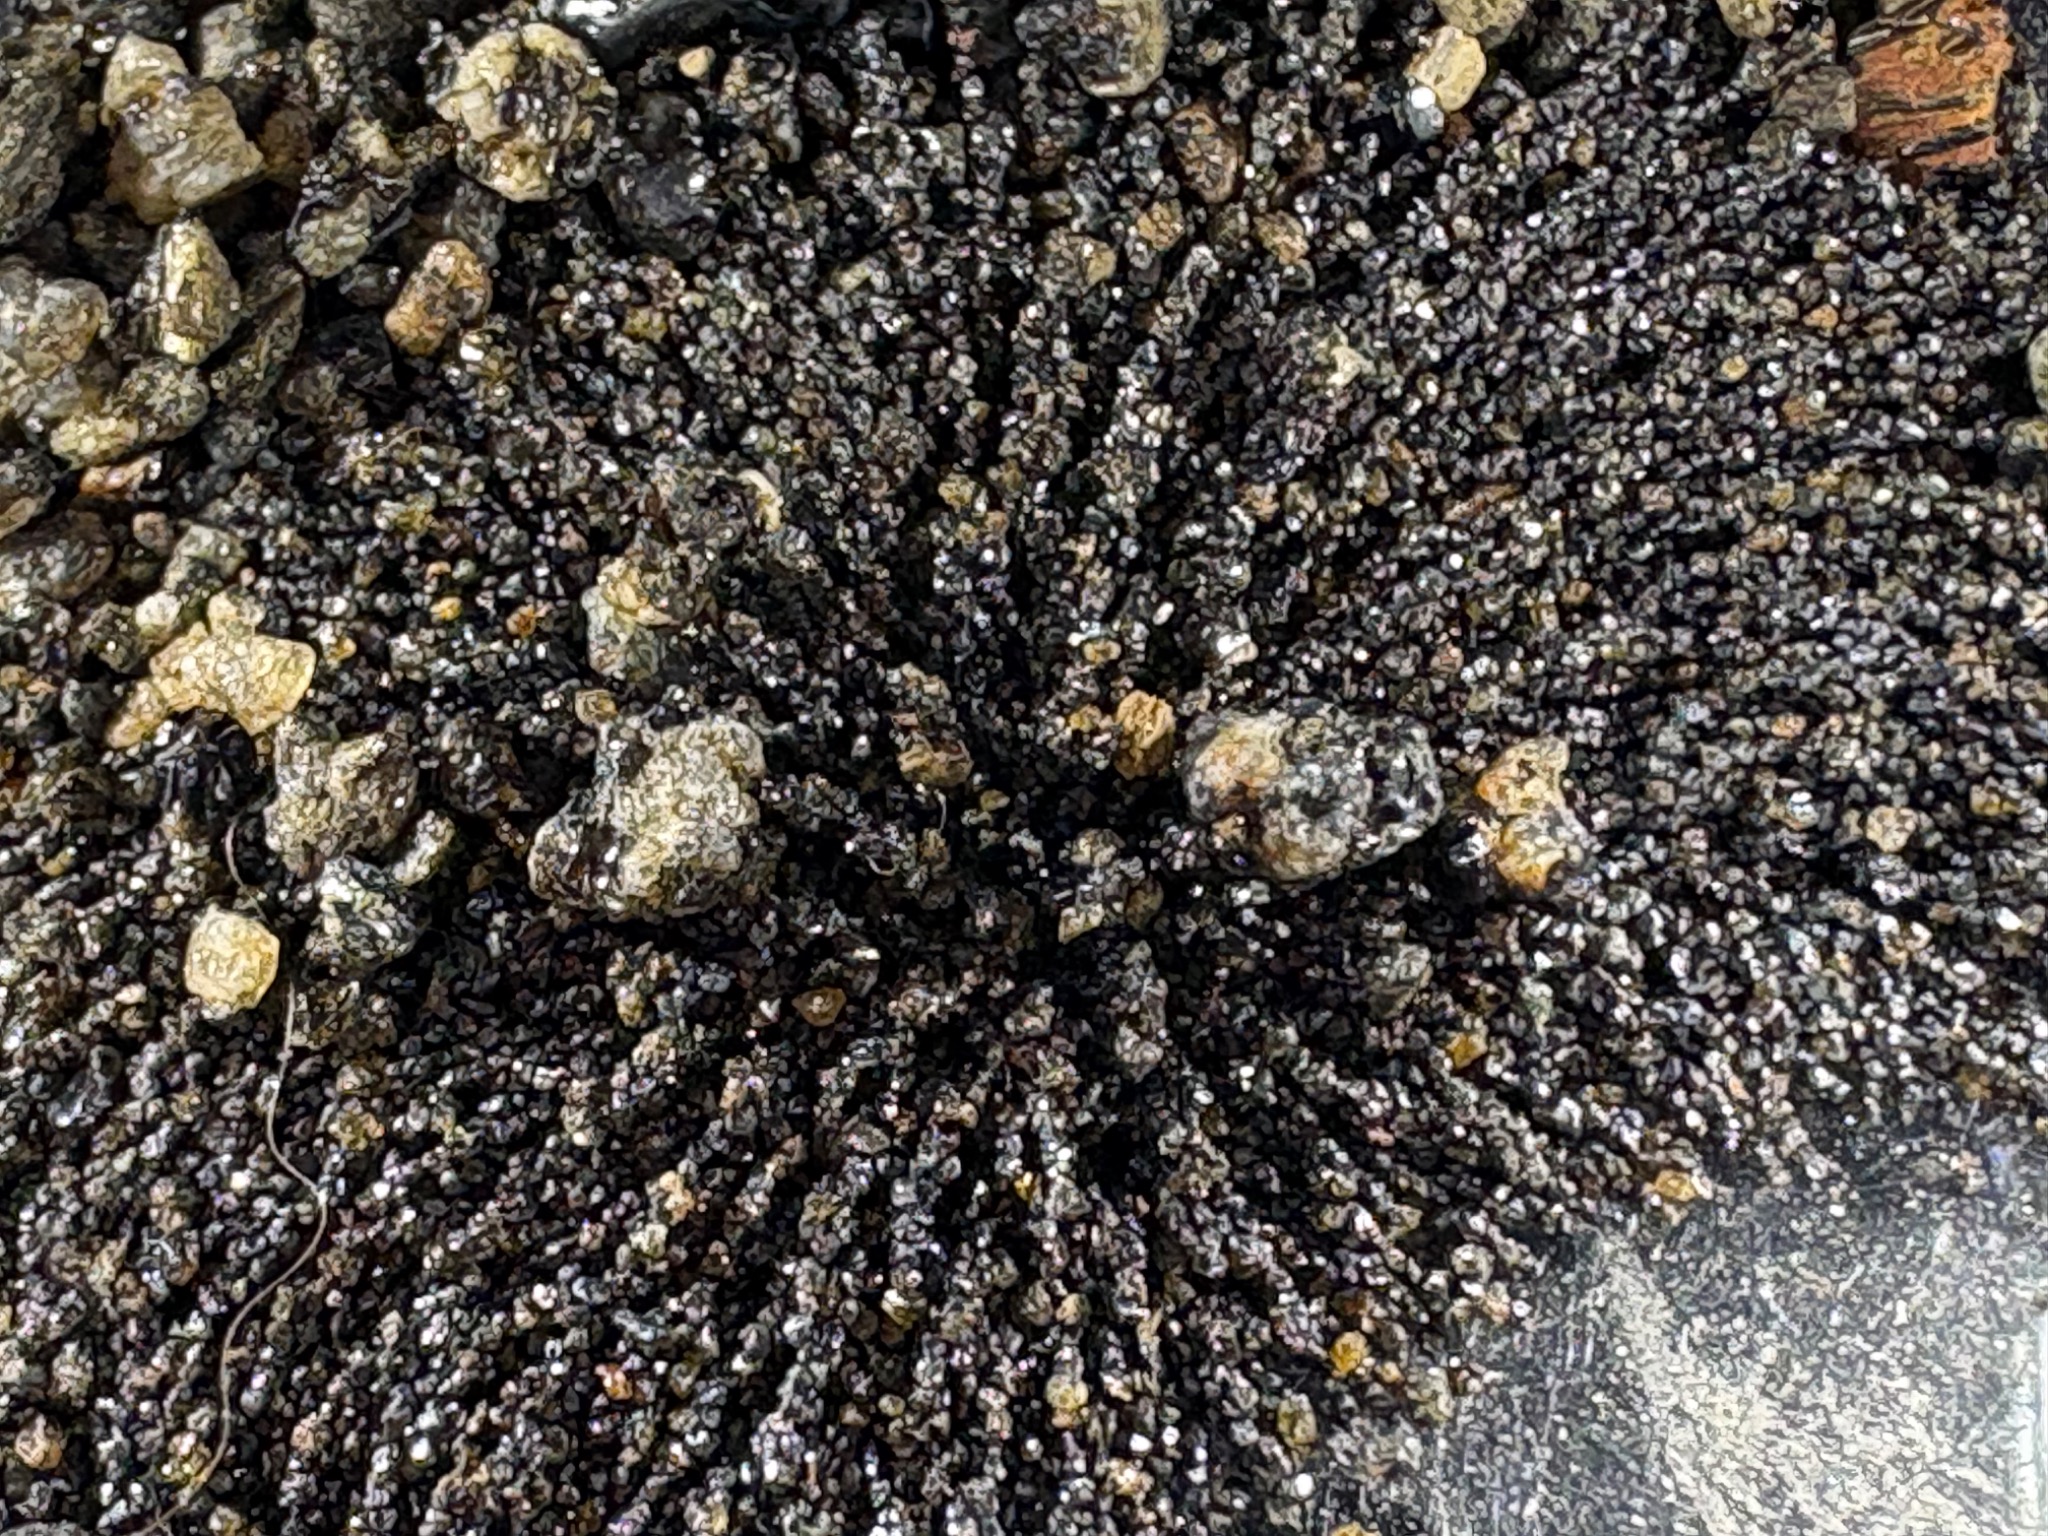
Provenance: author-supplied photographs, provided for this site on 22 October 2026. No magnet or other object has been digitally added. Images are contextual observations, not quantitative results.
HOW THE STUDY WORKED
The paper reports collection between 2003 and 2010 from the top three inches of beach surface material, followed by storage and analysis in 2023.
These are historical samples, not a present-day island-wide survey.
XRF was used to measure elemental concentrations. The methods describe sample preparation, calibration using reference materials, and replicate measurements.
Elemental concentration does not by itself establish chemical form or biological availability.
The paper reports t-tests, ANOVA, Mann–Whitney U tests, and a multivariate comparison of the five metals together.
Different tests answer different statistical questions; their results should remain distinguishable.
Source: Methodology and Table 2, pp. 396–397. The author clarified that four analytical samples came from one container and one from the other, each divided into four separate portions. Laboratory replicates should not be treated as additional independent field locations.
SAMPLE HISTORY / KEEP THE DATES SEPARATE
The paper reports beach-surface collection during this period. These dates do not identify present-day conditions.
Retained material was analyzed after storage. Analysis date is distinct from collection date.
Published online on 2 December 2024; included in the 2025 journal volume.
Sources: published Methodology, pp. 396–397, and article publication details. The timeline does not imply repeated environmental sampling between these dates.
WHAT THE PAPER REPORTS
| Metal | Reported result | Interpretation boundary |
|---|---|---|
| Mercury (Hg) | Higher in the Iwo Jima samples; significant differences reported in t-test, ANOVA, and Mann–Whitney comparisons. | A difference from regional literature values does not uniquely identify a wartime source. |
| Chromium (Cr) | Lower in the Iwo Jima samples; significant differences reported across the same tests. | A significant difference is not necessarily an increase or evidence of contamination. |
| Zinc (Zn) | A significant difference in the Mann–Whitney comparison; no significant difference in the reported t-test or ANOVA. | The finding depends on the statistical comparison used. |
| Lead (Pb) & copper (Cu) | No significant differences in the individual-metal tests reported in Table 2. | This does not establish absence, safety, or equivalence between the sampled materials. |
The paper also reports an overall difference in the combined metal profiles. That result concerns the multivariate comparison; it does not mean every metal was individually elevated.
“Significant” here refers to the paper’s reported p < 0.05 criterion. These results are summarized from the published article, not independently reanalyzed for this page.
WHAT THIS CAN—AND CANNOT—ESTABLISH
The measurements provide a basis for further investigation. Their reach depends on the sampling design.
Spatial coverage: Retained samples do not establish how concentrations vary across the beach or the whole island.
Background geology: Volcanic soils differ naturally. Comparisons from La Réunion and Malaysia are informative context, but cannot substitute for a well-characterized local background.
Storage: The paper discusses possible effects of long-term storage on sample properties. Collection dates and analysis dates must remain separate.
Attribution: The article interprets the results in relation to military activity. Separating wartime inputs from volcanic and later sources requires additional source-specific evidence.
Fate and effects: XRF concentrations alone cannot establish groundwater transport, uptake by organisms, exposure dose, or health outcomes. Those questions need their own measurements.
WHY IT MATTERS
Warfare ecology asks us to examine what remains after a site becomes a memorial.
This study brings an environmental question to a historically significant beach. Its value includes both the measurements it reports and the further questions they raise: how representative are the samples, which sources contributed, and what processes affect the residues now?
Stronger spatial sampling, local geological comparisons, and targeted studies of chemical form and transport would help distinguish the environmental processes involved.
This page summarizes the published 2024/2025 article. The separate fragment explorer below presents author-supplied follow-up data; it is not part of this published-study summary.
ANALYTICAL RECORDS / UPDATED 23 OCTOBER 2026
XRF measurements of metals in retained Iwo Jima material
Decades after the Battle of Iwo Jima, retained material from the island’s volcanic environment offers a record to investigate. X-ray fluorescence (XRF) measurements report elemental concentrations in iron-rich materials, including lead, copper, zinc, manganese and barium.
The measurements are consistent with material from a landscape containing legacy military debris, although elemental concentrations alone cannot establish whether a particular metal originated from military activity or natural geology.
The author confirms that the instrument was an Olympus Innov-X X-5000 portable energy-dispersive XRF analyzer, operated in Soil Mode with a reported acquisition time of 180 seconds per scan. These operating details are author-reported; original scan records have not been independently verified for every dataset.
Available records include three averaged elemental datasets, 38 numbered metallic-fragment measurements, and an author-reported separate table containing six groups of triplicate analyses. Some records may overlap. Their sampling relationships have not yet been fully reconstructed; they must not be pooled as independent observations or equated with the published five-sample study.
Instrument identification resolved by the author: Olympus Innov-X X-5000. The Thermo Niton reference in an older manuscript draft was incorrect. This correction identifies the instrument; it does not replace original calibration or quality-control records.
Reconciled at the author-report level: two containers supplied five samples (four from one, one from the other); four separate portions per sample give 20 analytical portions. These are not 20 independent field locations. Original laboratory identifiers have not been matched to this diagram.
Recovered published description: the paper’s Analytical Technique section (printed p. 396) reports reference-material calibration, triplicate reference readings, blank correction, precision checks using relative percent difference, and periodic recalibration. This documents what the paper reports; it is not the underlying quality-control dataset.
Still needed: original scan exports and sample identifiers, dated run logs, reference-material names and certified values, measured recoveries, blank results, precision results and acceptance criteria, and measurement-specific detection limits. The three averaged datasets, 38 fragment readings and six triplicate groups must remain separate until their record-level relationships are established. Do not sum them into a total sample count.
| Element | Reported range | Unit |
|---|---|---|
| Lead (Pb) | 5–304 | mg/kg |
| Mercury (Hg) | 5.5–17 | mg/kg |
| Barium (Ba) | 2,903–4,010 | mg/kg |
| Copper (Cu) | 47–222 | mg/kg |
| Zinc (Zn) | 409.5–2,556 | mg/kg |
| Manganese (Mn) | 3,569–4,209 | mg/kg |
| Iron (Fe) | Greater than 10 in all three | % |
Source: author-supplied table labeled “Sample 1–3 AVG, 2008–2010.” Dates reproduce the source labels and do not independently establish scan dates. Tank debris is excluded. Ranges exclude zero-coded nondetections; the original averaging treatment of nondetects remains unresolved. Mercury entries are 15, 17 and 5.5 mg/kg, so their range is 5.5–17, not 5.5–27.
Numerical context only · concentrations in mg/kg
| Element | Reference value (mg/kg) |
|---|---|
| Lead (Pb) | 150 |
| Mercury (Hg) | 15 |
| Arsenic (As) | 150 |
| Selenium (Se) | 150 |
These standards use prescribed soil-content testing under Japan’s Soil Contamination Countermeasures Act. XRF readings are not a direct compliance test.
| Reference type | Lead (mg/kg) |
|---|---|
| Screening level | 200 |
| Regional removal management level | 600 |
Applies to residential soil in CERCLA/Superfund and RCRA hazardous-waste cleanup programs. These are two different reference types, not interchangeable cleanup targets.
Some reported XRF values are numerically above these references. However, XRF elemental measurements are not equivalent to Japan’s prescribed soil-content testing method. U.S. program values are comparative context, not Japanese requirements. These comparisons do not determine regulatory noncompliance, human exposure or required remediation.
The preliminary results justify additional investigation, particularly for lead, mercury and potentially interfered measurements. Volcanic mineral composition, iron-rich matrices, sample heterogeneity, detection limits and incomplete instrument records affect interpretation.
Additional calibrated measurements, reference materials, appropriate confirmatory laboratory testing and local geological background samples would strengthen conclusions about environmental contamination and its origins.
FOLLOW-UP DATA / 38 INDIVIDUAL FRAGMENTS
Explore the elemental readings supplied by Carrie A. Shuster. These 38 numbered fragment records are displayed separately from the five-sample sand study above. Their relationship to the collection containers, other analytical records and analysis dates remains unresolved; independence or non-overlap is not established.
What these readings show: quantified lead varies among fragments; some elements are non-detects, while several readings exceed the reported range. Composition alone does not establish a wartime source, ammunition type, or exposure risk.
| Fragment | Reported reading | Status |
|---|
The author confirmed that unmarked numbers are ppm (mg/kg), N/A means non-detect, and each row represents an individual fragment. Percent values are converted using 1% = 10,000 mg/kg. An entry of >10% remains >100,000 mg/kg. Detection limits were not supplied.
The displayed mean uses quantified readings only, excluding ND and above-range values. It is not a mean for all 38 fragments, a beach-wide estimate, or a replacement for a censored-data analysis. No error bars or pooled sand/fragment statistics are calculated.
Recalculation identifies differences from the supplied averages: Mn 3,097.95 versus 3,357; Pb 132.10 versus 120; Hg 14.10 versus 14.2 mg/kg. The original table is preserved below. Its material/source interpretations are hypotheses, not independently verified classifications.
Source: author-supplied table and clarification, 23 October 2026. Raw instrument files, calibration records, detection limits and fragment selection methods have not been reviewed for this display.
Download readings and qualifiers (CSV) · Original supplied table (includes unverified interpretations)
FROM THIS STUDY / TO THE NEXT QUESTIONS
Independent samples across defined locations would help describe variability. A local geological comparison would strengthen interpretation of the volcanic background.
Source-specific material analysis and documented site histories could help test military, geological, and later contributions.
Chemical form, transport, uptake, and exposure each need appropriate measurements. Elemental XRF results alone cannot answer them.
THE EQUIPMENT GOAL
The XRF campaign aims to support continued measurements in war-affected sediments. These are research priorities, not a funded or scheduled Iwo Jima field campaign. Equipment is one part of a study; sampling design and quality control remain essential.
Contributions are open through PayPal on the equipment-fund page. The instrument model, purchase budget and funding target await a confirmed quote.
THE PUBLICATION
Shuster, C. A. (2025). Black Sands of Iwo Jima: How the Past Can Improve the Future of Warfare. Environmental Forensics, 26(3), 393–411. Published online 2 December 2024.
DOI: 10.1080/15275922.2024.2431317