A changed shoreline
The comparison shows exposed margins and changed surface water. Image color cannot identify dissolved contaminants or measure metal concentrations.
A VISUAL INVESTIGATION · KAKHOVKA, UKRAINE
A broken dam. A disconnected water system. A landscape still changing.
Trace the evidence from satellite images to field research—and see where the evidence stops.
01 / LOOK CLOSELY
The Kakhovka Dam breached on 6 June 2023. These Landsat 9 views show nearby reservoir shores and canal inlets before and after. [1]
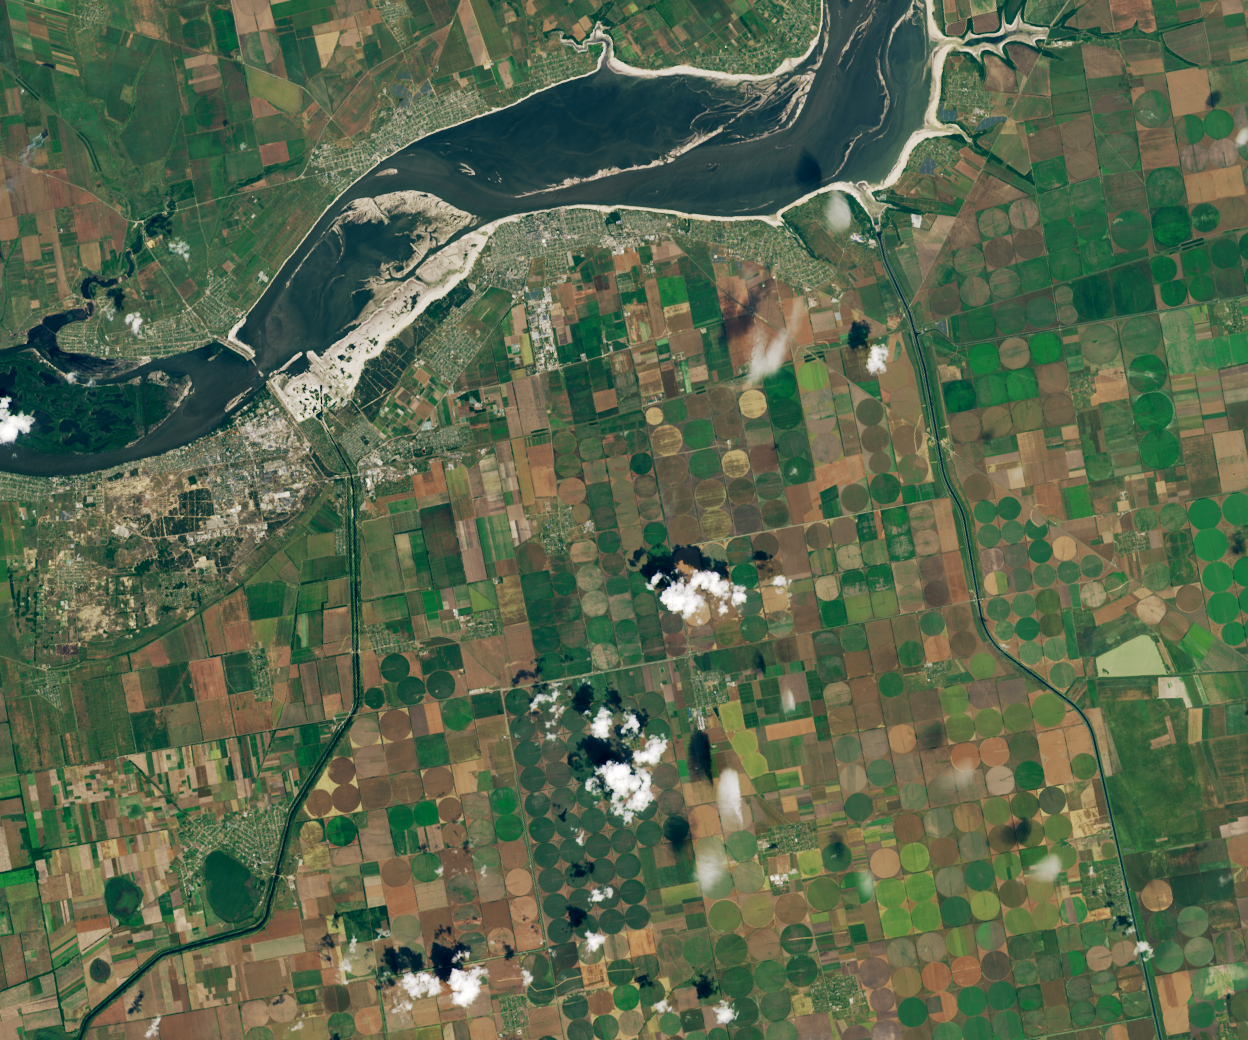
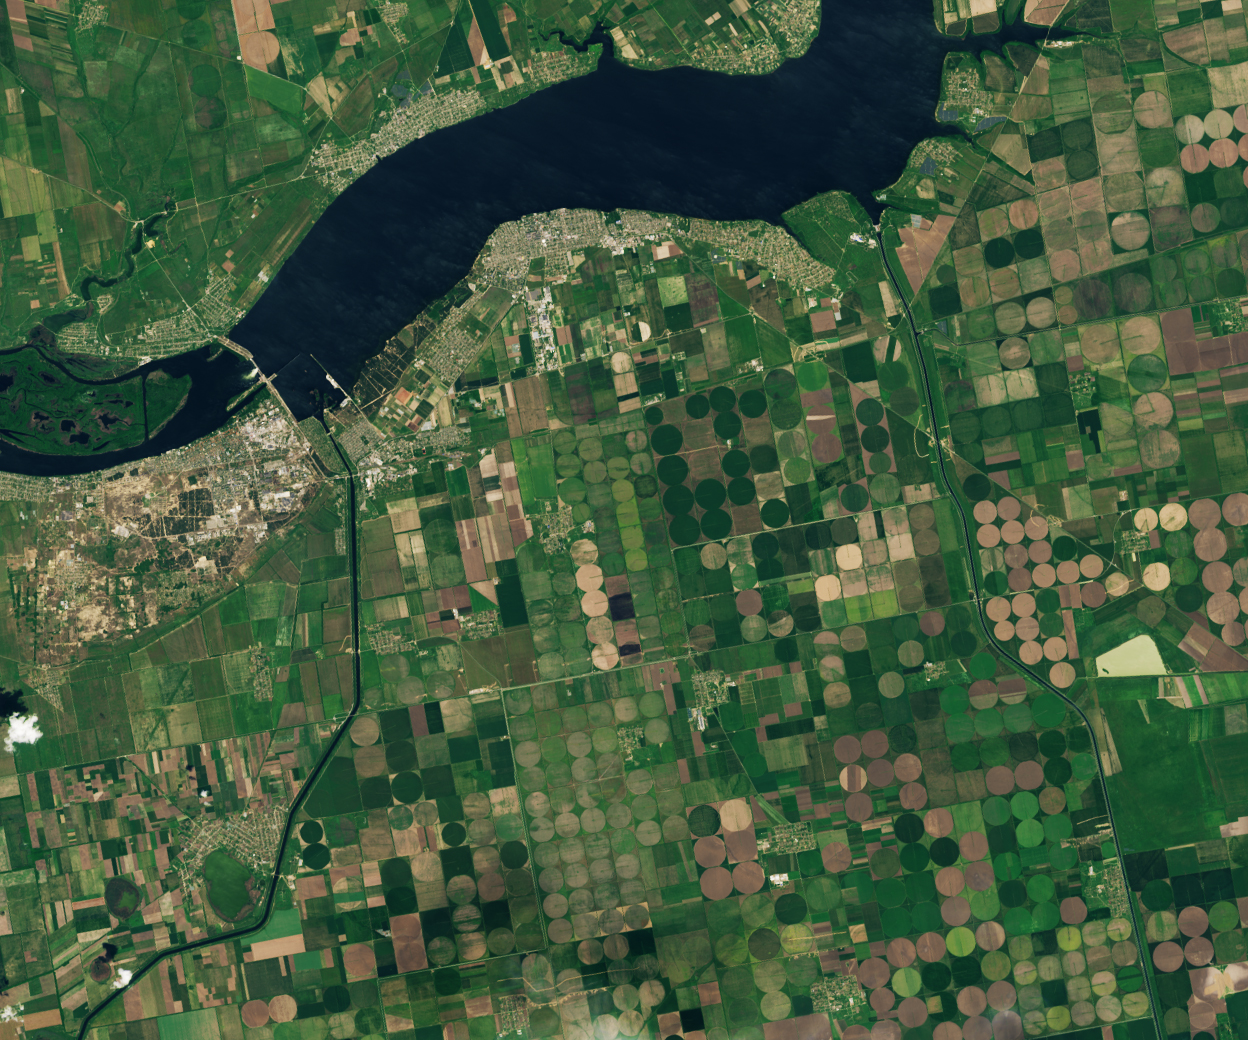 17 MAY 202318 JUN 2023
Drag the slider or use the arrow keys. Before is on the left; after is on the right.
CHOOSE SOMETHING TO EXAMINE
Markers are visual guides to features, not sampling locations.
Look for the water connection. NASA reports that reservoir levels fell below the canal intake requirements. Browner fields in this pair reflect the normal harvest cycle; their color alone is not evidence of crop failure. [1]
02 / FOLLOW THE CHANGE
The comparison shows exposed margins and changed surface water. Image color cannot identify dissolved contaminants or measure metal concentrations.
NASA’s July 2023 account describes canal networks losing their reservoir connection, with consequences for irrigation. It is a dated assessment, not a live service-status report. [1]
This image pair does not establish current drinking-water safety, sediment chemistry, exposure or farm income. Those questions need dated measurements and service or livelihood records.
03 / RECOVERY IS A QUESTION
Plants are establishing on the former reservoir bed. That tells us something specific about vegetation.
Kuzemko and colleagues documented changing plant communities across surveyed parts of the former reservoir. Early annual plants gave way to more perennial herbs, with willow and poplar central to the emerging vegetation. [2]
Scope matters: these botanical observations do not measure contaminant removal or prove that water supplies, fisheries or livelihoods have recovered.
Repeated water-quality tests alongside records of reliable supply, treatment and access. A greener satellite image cannot answer these questions.
Georeferenced sampling, analytical quality control and appropriate background comparisons, with detection limits and sampling dates.
Repeated ecological surveys and records of fishing, farming and household impacts, with comparable baselines and clearly defined areas.
The useful question is not simply “Has it recovered?” It is “Which part of the system, according to what evidence?”
THE EVIDENCE TRAIL
This is a historical case study, not a current incident feed. New findings require a new source and observation date.